Momentum Indicator [LeonidasCrypto]
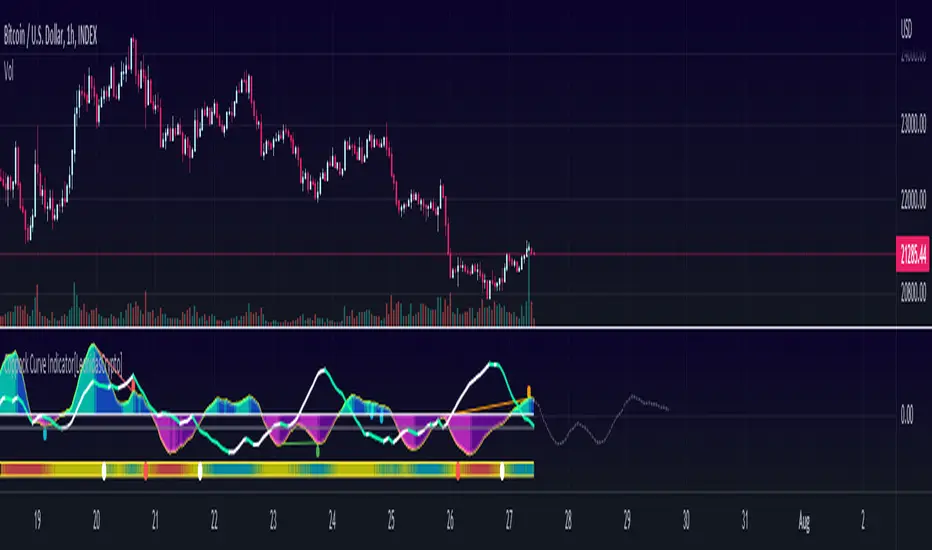
Coppock Curve Indicator Summary
The Coppock Curve (CC) was introduced by economist Edwin Coppock in an October 1962 issue of Barron's
While useful, the indicator is not commonly discussed among traders and investors. Traditionally used to spot long-term trend changes in major stock indexes, traders can use the indicator for any time and in any market to isolate potential trend shifts and generate trade signals.
How to use it:
0 line is the key level Above 0 line the momentum is getting strong(bullish) below 0 line the momentum is weak(bearish)
Buy signal:
In combination with ADX, Volatility :
Wait for the curve color turning to Dark Purple(weak bearish momentum) and ADX slope in the opposite side of the trend
Sell Signal.
Wait for the curve color turning to Dark Blue (weak bull momentum) and ADX slope in the opposite side of the trend
Explosive Moves.
This indicator will help you to catch explosive moves :
Wait for the bar in the bottom of the indicator[Volatility Bar] turned blue color[Consolidation] low volatility. Enter in the next buy/sell signal following the rules I described above using this strategy you will catch in many cases very good move.
Divergences:
This indicator will help you to identify divergences
Combine the divergences generated by this indicator with the sell/bull signals to increase the probabilities for a good trade setup.
Now you can see the current value of ADX
Bearish/Bullish Curve
Background panel will change the color same as the Curve(Momentum)
Added cross points in the Volatility Bar with this information you will know when volatility is expanding/contracting.
How to use it:
if you enable this feature you will be able to see a potential projection of the signal.
This is a game changer feature because you will be able to anticipate potential buy/sell signals with this indicator.
Skrypt tylko na zaproszenie
Dostęp do tego skryptu mają wyłącznie użytkownicy zatwierdzeni przez autora. Aby z niego korzystać, należy poprosić o zgodę i ją uzyskać. Zgoda jest zazwyczaj udzielana po dokonaniu płatności. Więcej informacji można znaleźć w instrukcjach autora poniżej lub kontaktując się bezpośrednio z LeonidasCrypto.
TradingView NIE zaleca płacenia za skrypt ani korzystania z niego, jeśli nie ma pełnego zaufania do jego autora i nie rozumie się zasad jego działania. Można również znaleźć darmowe, otwartoźródłowe alternatywy w skryptach społeczności.
Instrukcje autora
Wyłączenie odpowiedzialności
Skrypt tylko na zaproszenie
Dostęp do tego skryptu mają wyłącznie użytkownicy zatwierdzeni przez autora. Aby z niego korzystać, należy poprosić o zgodę i ją uzyskać. Zgoda jest zazwyczaj udzielana po dokonaniu płatności. Więcej informacji można znaleźć w instrukcjach autora poniżej lub kontaktując się bezpośrednio z LeonidasCrypto.
TradingView NIE zaleca płacenia za skrypt ani korzystania z niego, jeśli nie ma pełnego zaufania do jego autora i nie rozumie się zasad jego działania. Można również znaleźć darmowe, otwartoźródłowe alternatywy w skryptach społeczności.