OPEN-SOURCE SCRIPT
Relative Strength Index with Highlights and Success Test
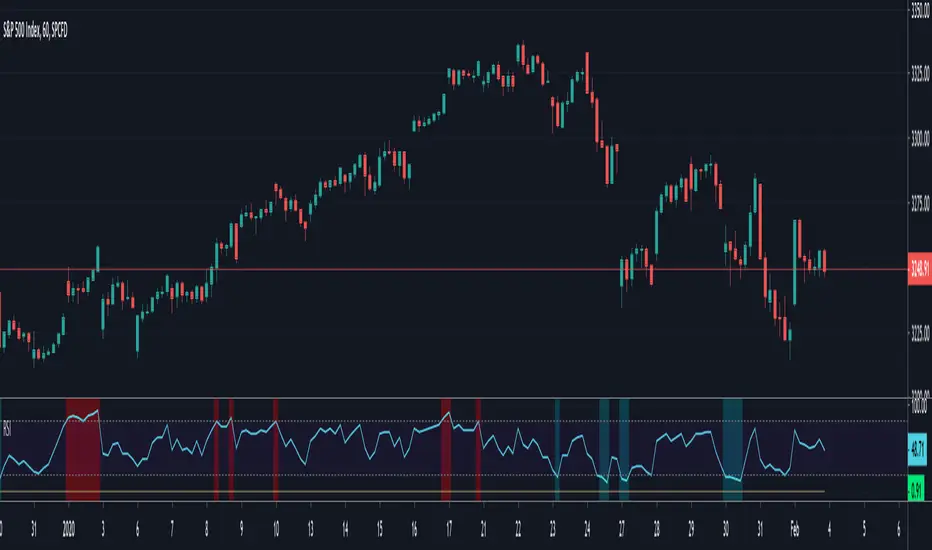
This script does two things:
1- Highlights extreme levels on RSI
2- Calculates what % of the time, price closed higher (lower) with some minimum threshold when RSI was below oversold (overbought) level in a predefined number of bars.
I use this to understand if buying the dip/selling the rip works for a security and on what time frame and if it could be a profitable strategy that can generate large enough moves.
No guarantees on the accuracy of the code. Let me know if you see anything wrong
Skrypt open-source
W zgodzie z duchem TradingView twórca tego skryptu udostępnił go jako open-source, aby użytkownicy mogli przejrzeć i zweryfikować jego działanie. Ukłony dla autora. Korzystanie jest bezpłatne, jednak ponowna publikacja kodu podlega naszym Zasadom serwisu.
Wyłączenie odpowiedzialności
Informacje i publikacje nie stanowią i nie powinny być traktowane jako porady finansowe, inwestycyjne, tradingowe ani jakiekolwiek inne rekomendacje dostarczane lub zatwierdzone przez TradingView. Więcej informacji znajduje się w Warunkach użytkowania.