OPEN-SOURCE SCRIPT
EWMA Volatility Bands
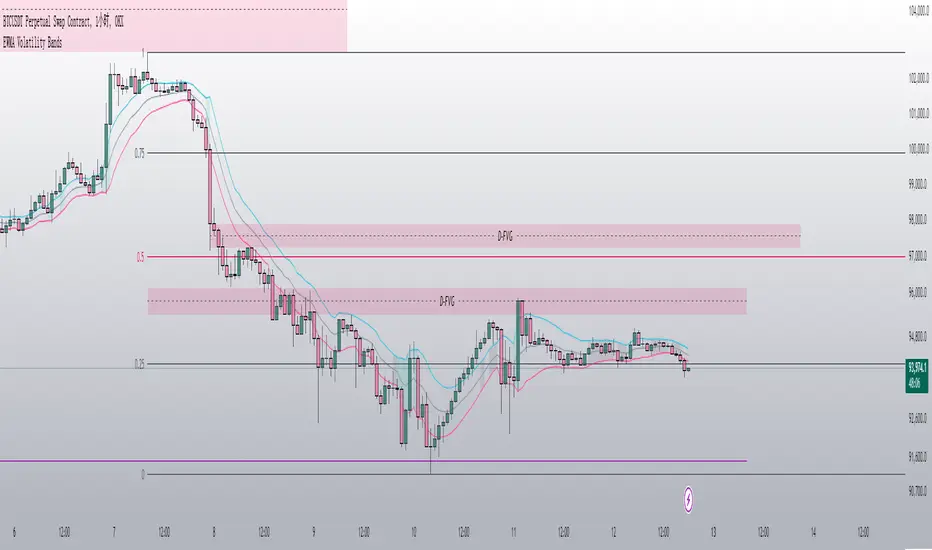
The EWMA Volatility Bands indicator combines an Exponential Moving Average (EMA) and Exponentially Weighted Moving Average (EWMA) of volatility to create dynamic upper and lower price bands. It helps traders identify trends, measure market volatility, and spot extreme conditions. Key features include:
Centerline (EMA): Tracks the trend based on a user-defined period.
Volatility Bands: Adjusted by the square root of volatility, representing potential price ranges.
Percentile Rank: Highlights extreme volatility (e.g., >99% or <1%) with shaded areas between the bands.
This tool is useful for trend-following, risk assessment, and identifying overbought/oversold conditions.
Skrypt open-source
W zgodzie z duchem TradingView twórca tego skryptu udostępnił go jako open-source, aby użytkownicy mogli przejrzeć i zweryfikować jego działanie. Ukłony dla autora. Korzystanie jest bezpłatne, jednak ponowna publikacja kodu podlega naszym Zasadom serwisu.
Wyłączenie odpowiedzialności
Informacje i publikacje nie stanowią i nie powinny być traktowane jako porady finansowe, inwestycyjne, tradingowe ani jakiekolwiek inne rekomendacje dostarczane lub zatwierdzone przez TradingView. Więcej informacji znajduje się w Warunkach użytkowania.