OPEN-SOURCE SCRIPT
Zaktualizowano RSI & Stoch MultiTime

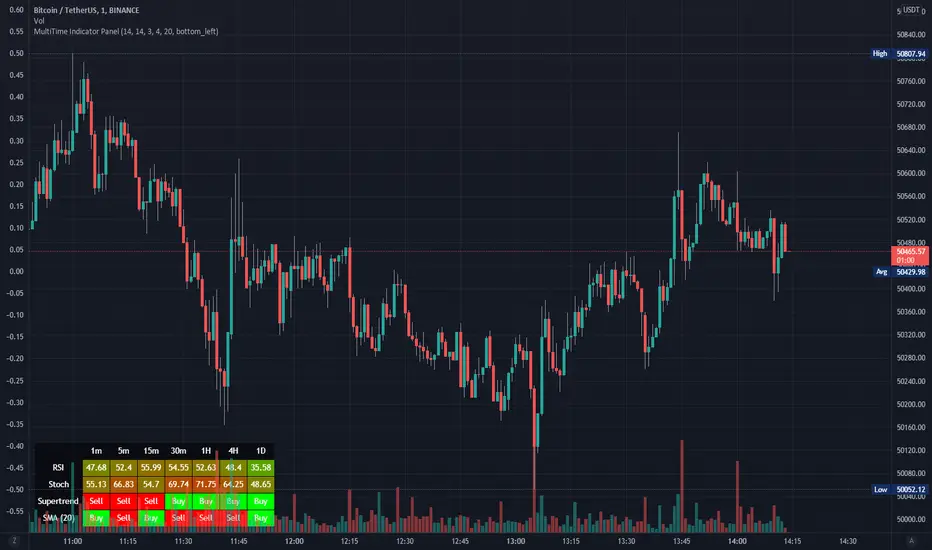
This indicator renders a table with 2 rows and 7 columns displaying the values of RSI and Stoch over different time periods. This works best on 1m charts due to a bug with the time periods I haven't yet solved.
Informacje o Wersji
Updated script to support easily adding a new indicator as a signal.Added Supertrend and SMA to indicators table
You can now specify the period of each indicator in the config
Added config option for table alignment for users who want to overlay on their chart
Informacje o Wersji
Fixed mistake where signal color and text was backwards.Skrypt open-source
W zgodzie z duchem TradingView twórca tego skryptu udostępnił go jako open-source, aby użytkownicy mogli przejrzeć i zweryfikować jego działanie. Ukłony dla autora. Korzystanie jest bezpłatne, jednak ponowna publikacja kodu podlega naszym Zasadom serwisu.
🚀 Founder of SciQua | Strategy. Simulation. Signals.
TradingView indicators, backtesting tools, weekly contests, and live market analysis.
Join free, compete, win, and stay updated at sciqua.com
TradingView indicators, backtesting tools, weekly contests, and live market analysis.
Join free, compete, win, and stay updated at sciqua.com
Wyłączenie odpowiedzialności
Informacje i publikacje nie stanowią i nie powinny być traktowane jako porady finansowe, inwestycyjne, tradingowe ani jakiekolwiek inne rekomendacje dostarczane lub zatwierdzone przez TradingView. Więcej informacji znajduje się w Warunkach użytkowania.
Skrypt open-source
W zgodzie z duchem TradingView twórca tego skryptu udostępnił go jako open-source, aby użytkownicy mogli przejrzeć i zweryfikować jego działanie. Ukłony dla autora. Korzystanie jest bezpłatne, jednak ponowna publikacja kodu podlega naszym Zasadom serwisu.
🚀 Founder of SciQua | Strategy. Simulation. Signals.
TradingView indicators, backtesting tools, weekly contests, and live market analysis.
Join free, compete, win, and stay updated at sciqua.com
TradingView indicators, backtesting tools, weekly contests, and live market analysis.
Join free, compete, win, and stay updated at sciqua.com
Wyłączenie odpowiedzialności
Informacje i publikacje nie stanowią i nie powinny być traktowane jako porady finansowe, inwestycyjne, tradingowe ani jakiekolwiek inne rekomendacje dostarczane lub zatwierdzone przez TradingView. Więcej informacji znajduje się w Warunkach użytkowania.