OPEN-SOURCE SCRIPT
Zaktualizowano Relative chart analysis using arithmetic operators
Relative chart analysis using arithmetic operators.
Informacje o Wersji
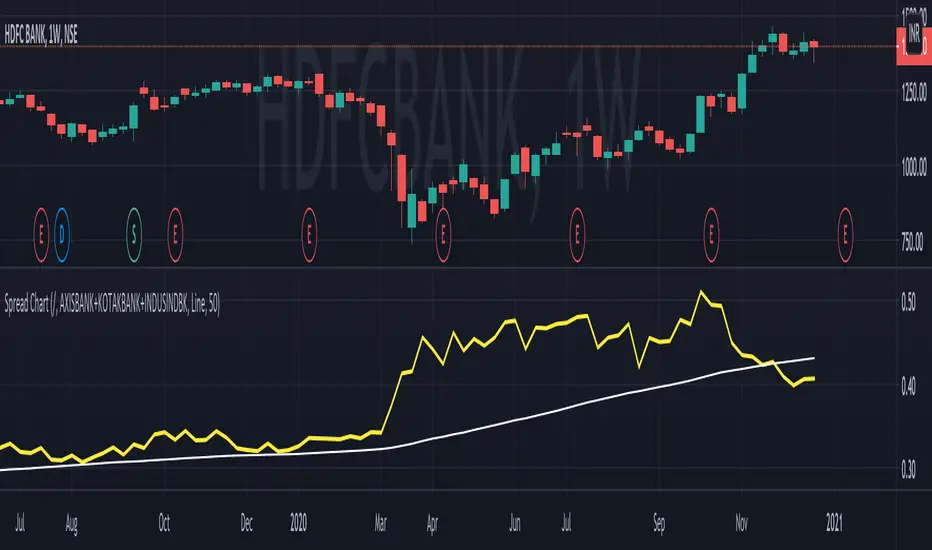
- Now line plots are available and the default option
- The 50 Period Moving Average is also plotted by default
Usage:
On can plot a combination of number of mathematical operators. The input source, can itself also be a combination of different scrips. For example, in this example, we compare (divide / ) HDFCBANK with a "synthetic benchmark" of other competing private banks by combining (AXIS + KOTAK + INDUSIND) in the input.
Skrypt open-source
W zgodzie z duchem TradingView twórca tego skryptu udostępnił go jako open-source, aby użytkownicy mogli przejrzeć i zweryfikować jego działanie. Ukłony dla autora. Korzystanie jest bezpłatne, jednak ponowna publikacja kodu podlega naszym Zasadom serwisu.
Wyłączenie odpowiedzialności
Informacje i publikacje nie stanowią i nie powinny być traktowane jako porady finansowe, inwestycyjne, tradingowe ani jakiekolwiek inne rekomendacje dostarczane lub zatwierdzone przez TradingView. Więcej informacji znajduje się w Warunkach użytkowania.