OPEN-SOURCE SCRIPT
Zaktualizowano Overlay Candles (Multi-TF, right side projection)

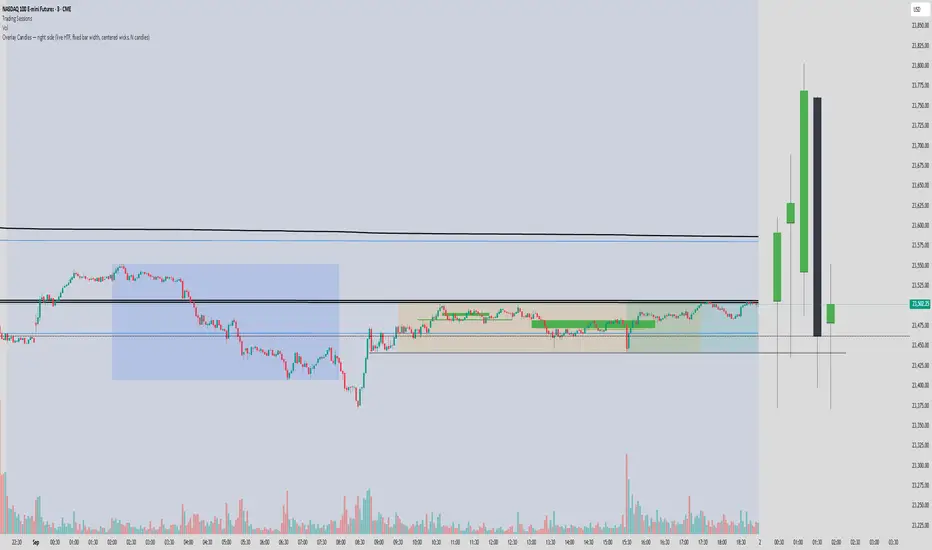
This script overlays candles from a custom selectable timeframe (5m to 1M) on the right side of the chart as projections.
It helps visualize and compare the ongoing price action with the last higher-timeframe candles without switching chart intervals.
Features:
Choose timeframe for overlay candles (5m, 15m, 1H, 4H, 1D, 1W, 1M).
Adjustable number of candles to display (1–8).
Fixed candle width (in bars) and configurable gap between candles.
Custom colors for bullish and bearish candles.
Adjustable wick and border thickness (px).
Candle borders drawn with four lines to ensure visibility at all zoom levels.
Use cases:
Multi-timeframe price action analysis.
Visualizing higher-timeframe structure alongside lower-timeframe trading.
Educational / visual aid for understanding candlestick context.
Informacje o Wersji
This script overlays candles from a custom selectable timeframe (5m to 1M) on the right side of the chart as projections.It helps visualize and compare the ongoing price action with the last higher-timeframe candles without switching chart intervals.
Features:
Choose timeframe for overlay candles (5m, 15m, 1H, 4H, 1D, 1W, 1M).
Adjustable number of candles to display (1–8).
Fixed candle width (in bars) and configurable gap between candles.
Custom colors for bullish and bearish candles.
Adjustable wick and border thickness (px).
Candle borders drawn with four lines to ensure visibility at all zoom levels.
Use cases:
Multi-timeframe price action analysis.
Visualizing higher-timeframe structure alongside lower-timeframe trading.
Educational / visual aid for understanding candlestick context.
Skrypt open-source
W zgodzie z duchem TradingView twórca tego skryptu udostępnił go jako open-source, aby użytkownicy mogli przejrzeć i zweryfikować jego działanie. Ukłony dla autora. Korzystanie jest bezpłatne, jednak ponowna publikacja kodu podlega naszym Zasadom serwisu.
Wyłączenie odpowiedzialności
Informacje i publikacje nie stanowią i nie powinny być traktowane jako porady finansowe, inwestycyjne, tradingowe ani jakiekolwiek inne rekomendacje dostarczane lub zatwierdzone przez TradingView. Więcej informacji znajduje się w Warunkach użytkowania.