OPEN-SOURCE SCRIPT
Combined SMA with Murrey Math and Fixed Fractal Bands
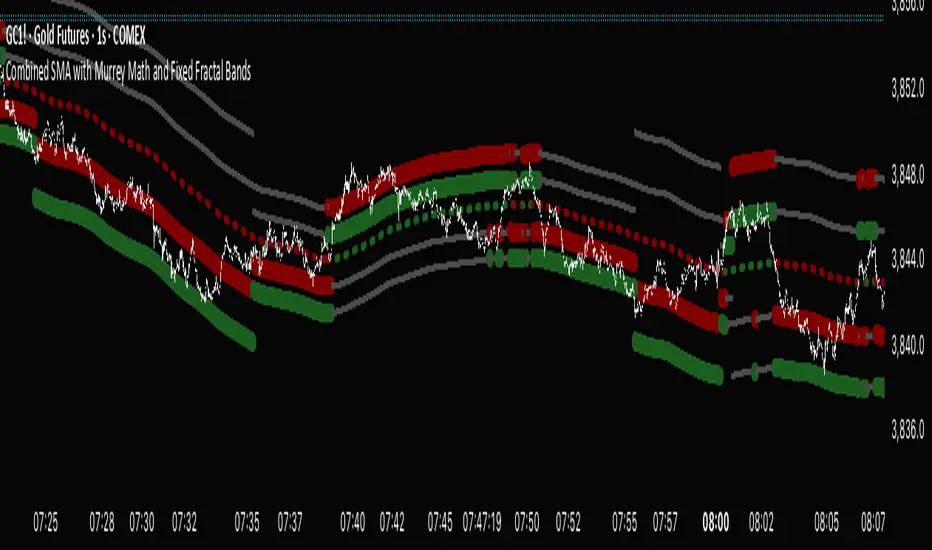
"Combined SMA with Murrey Math and Fixed Fractal Bands" , overlaying a Simple Moving Average (SMA), Murrey Math (MM) bands, and fixed fractal bands on a price chart. Here's a brief description of its functionality:Inputs:SMA Length: Configurable period for the SMA (default: 180 bars).
Resolution: Optional custom timeframe for data.
Frame Size for MM: Lookback period for Murrey Math calculations (default: 180 bars, adjustable via multiplier).
Ignore Wicks: Option to use open/close prices instead of high/low for MM calculations.
Fixed Fractal Size: Fixed distance in points for fractal bands (default: 1.22).
Shade 3/8-5/8 Overlap: Option to highlight overlapping regions between SMA-centered and absolute MM bands.
Data Source:Uses open, close, high, and low prices from the specified ticker and timeframe.
Optionally ignores wicks (high/low) for MM calculations, using max/min of open/close instead.
SMA Calculation:Computes a Simple Moving Average (SMA) based on the closing price and user-defined length.
Murrey Math Bands:Absolute MM Bands: Calculated using a dynamic range based on the highest/lowest prices over a lookback period, scaled logarithmically to create 13 levels (from -3/8 to +3/8, with 8/8 as the midpoint). These adapt to price action.
SMA-Centered MM Bands: Constructs MM bands relative to the SMA, with levels (0/8 to 8/8) spaced by a calculated increment derived from the absolute MM range.
Colors bands dynamically (green for bullish, red for bearish, gray for neutral) based on changes in the 4/8 level or increment, with labels indicating "Higher," "Lower," or "Same" states.
Fixed Fractal Bands:Plots six fixed-distance bands (±1, ±2, ±3) around the SMA, using a user-defined point value (default: 1.22).
Overlaps and Shading:Detects overlaps between SMA-centered and absolute MM bands at key levels (7/8-8/8, 0/8-1/8, and optionally 3/8-5/8).
Shades overlapping regions with distinct colors (red for 7/8-8/8, green for 0/8-1/8, blue for 3/8-5/8).
Fills specific SMA-centered MM regions (3/8-5/8, 0/8-1/8, 7/8-8/8) for visual emphasis.
Visualization:Plots SMA-centered MM bands, absolute MM bands, and fixed fractal bands as stepped lines with varying colors and transparency.
Displays a table at the bottom-right showing the current MM increment value.
Adds labels when the 4/8 level or increment changes, indicating trend direction.
In summary, this indicator combines a user-defined SMA with Murrey Math bands (both absolute and SMA-centered) and fixed fractal bands to provide a multi-level support/resistance framework. It highlights dynamic price levels, trend direction, and key overlaps, aiding traders in identifying potential reversal or consolidation zones.
Skrypt open-source
W zgodzie z duchem TradingView twórca tego skryptu udostępnił go jako open-source, aby użytkownicy mogli przejrzeć i zweryfikować jego działanie. Ukłony dla autora. Korzystanie jest bezpłatne, jednak ponowna publikacja kodu podlega naszym Zasadom serwisu.
Wyłączenie odpowiedzialności
Informacje i publikacje nie stanowią i nie powinny być traktowane jako porady finansowe, inwestycyjne, tradingowe ani jakiekolwiek inne rekomendacje dostarczane lub zatwierdzone przez TradingView. Więcej informacji znajduje się w Warunkach użytkowania.