OPEN-SOURCE SCRIPT
CISD Trend Candle + MACD Signal
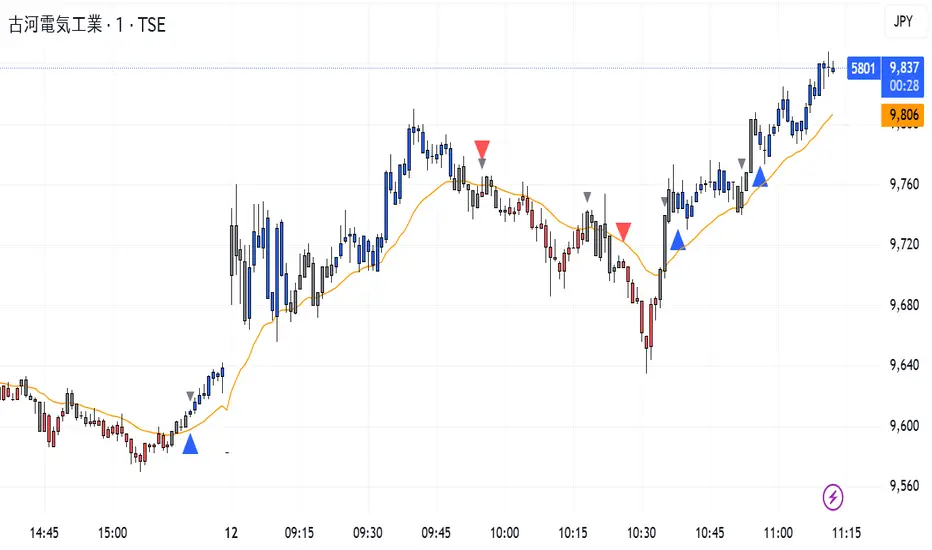
This custom TradingView indicator combines trend-based candle coloring with MACD reversal detection to generate clear entry and exit signals:
🔷 Blue triangle (Buy): Appears when the candles confirm an uptrend (e.g., 5 consecutive closes above 21 EMA) and no long position is currently held.
🔴 Red triangle (Sell): Appears when the candles confirm a downtrend (e.g., 5 consecutive closes below 21 EMA) and no short position is currently held.
⚪ Gray triangle (Exit):
If in a long position, it shows when the candle turns neutral (gray) and the MACD crosses down (bearish signal), or the trend turns red.
If in a short position, it shows when the candle turns neutral and the MACD crosses up (bullish signal), or the trend turns blue.
🟠 Orange line: 21-period EMA used for trend validation.
This logic prevents premature entries and provides structured exit points, aiming to avoid false signals in choppy markets.
Skrypt open-source
W zgodzie z duchem TradingView twórca tego skryptu udostępnił go jako open-source, aby użytkownicy mogli przejrzeć i zweryfikować jego działanie. Ukłony dla autora. Korzystanie jest bezpłatne, jednak ponowna publikacja kodu podlega naszym Zasadom serwisu.
Wyłączenie odpowiedzialności
Informacje i publikacje nie stanowią i nie powinny być traktowane jako porady finansowe, inwestycyjne, tradingowe ani jakiekolwiek inne rekomendacje dostarczane lub zatwierdzone przez TradingView. Więcej informacji znajduje się w Warunkach użytkowania.