OPEN-SOURCE SCRIPT
Variable Index Dynamic Average (VIDYA) with Histper
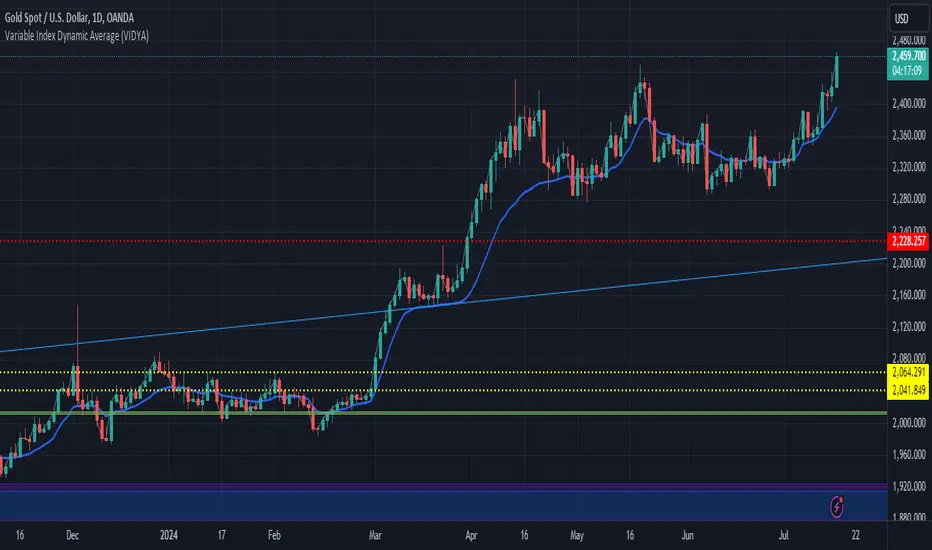
The Variable Index Dynamic Average (VIDYA) is a unique and adaptive moving average indicator designed to respond dynamically to market volatility. It adjusts its smoothing factor based on the standard deviation of price changes, making it more responsive during periods of high volatility and smoother during periods of low volatility. This version includes two key parameters:
Period: The number of bars used to calculate the VIDYA.
HistPer: The number of historical bars used to calculate the standard deviation, affecting the smoothness and responsiveness of the indicator.
Features:
Dynamic Adaptation: VIDYA adjusts its responsiveness based on market conditions, providing a balance between smoothness and responsiveness.
Customizable Parameters: Users can customize the Period and HistPer to fit their specific trading style and asset characteristics.
Overlay on Price Chart: The VIDYA is plotted directly on the price chart for easy visualization and integration with other technical analysis tools.
Usage:
Trend Identification: Use VIDYA to identify the prevailing trend. A rising VIDYA line indicates an uptrend, while a falling VIDYA line indicates a downtrend.
Entry and Exit Signals: Combine VIDYA with other indicators and trading strategies to confirm entry and exit signals.
Volatility Analysis: Adjust the HistPer to see how the indicator responds to different levels of market volatility.
Skrypt open-source
W zgodzie z duchem TradingView twórca tego skryptu udostępnił go jako open-source, aby użytkownicy mogli przejrzeć i zweryfikować jego działanie. Ukłony dla autora. Korzystanie jest bezpłatne, jednak ponowna publikacja kodu podlega naszym Zasadom serwisu.
Wyłączenie odpowiedzialności
Informacje i publikacje nie stanowią i nie powinny być traktowane jako porady finansowe, inwestycyjne, tradingowe ani jakiekolwiek inne rekomendacje dostarczane lub zatwierdzone przez TradingView. Więcej informacji znajduje się w Warunkach użytkowania.