PROTECTED SOURCE SCRIPT
Swiftmap CVD Bubbles & Heatmap
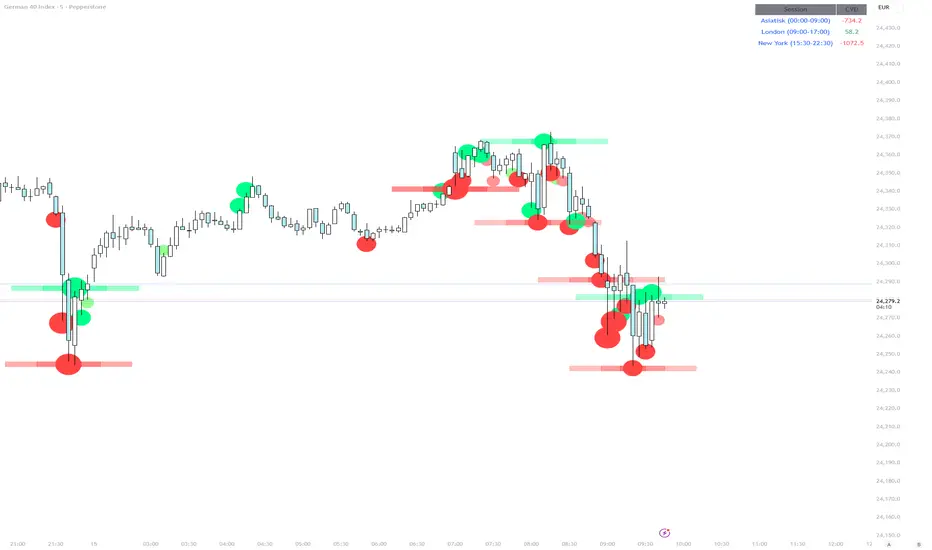
Session CVD Indicator is a powerful tool designed for traders analyzing market activity across major trading sessions: Asian (00:00–09:00), London (09:00–17:00), and New York (15:30–22:30) in CEST (UTC+2). It calculates Cumulative Volume Delta (CVD) for each session, providing insights into net buying or selling pressure. The indicator features a customizable heatmap inspired by Bookmap, with a gradient effect to visualize significant trades, along with optional bubbles and a session-based CVD table
Session-Based CVD: Tracks CVD separately for Asian, London, and New York sessions, with values frozen at the end of each session for easy comparison.
Gradient Heatmap: Displays buy-side (green) and sell-side (red) activity with a gradient effect, fading from intense color at the center to transparent edges, mimicking Bookmap’s visual style.
Lot Size Filter: Filters out small trades using a percentile-based threshold (bubble_percentile) to focus on significant market moves.
Bubbles for Big Trades: Visualizes large trades with customizable bubble sizes (tiny, small, normal, large, huge) based on delta strength.
Customizable Contrast: Adjusts heatmap visibility with a heatmap_contrast setting to filter out low-volume zones.
CEST Timezone: Hardcoded for CEST (UTC+2), ensuring accurate session timing for European traders.
CVD Table: Displays live or frozen CVD values in a table at the top-right of the chart, with green/red colors for positive/negative CVD.
How to Use
Add to Chart: Apply the indicator to a chart with volume data (e.g., EURUSD or BTCUSD on 1min–15min timeframes).
Set Timezone: Ensure your chart’s timezone is set to “Europe/Copenhagen” (CEST) for accurate session alignment.
Adjust Settings:
Session Times: Customize start/end times for Asian, London, and New York sessions (default: 00:00–09:00, 09:00–17:00, 15:30–22:30 CEST).
ATR Settings: Modify ATR Length (default 14) and ATR Threshold (default 0.5) to filter out small candles.
Lot Size Filter: Enable/disable with Use Lot Size Filter and adjust Big Trades Volume/Delta Percentile (default 50) to focus on significant trades.
Visuals: Toggle Show Bubbles, Minimal Mode (tiny dots only), Show Heatmap, and Show Debug Labels. Adjust Heatmap Contrast (default 0.3) to filter low-volume zones.
Warnings: Enable Show No Heatmap Zones Warning to display alerts if filters are too strict.
Interpret Results:
Table: View live CVD during a session or frozen CVD after it ends.
Heatmap: Green (buy-side) or red (sell-side) boxes (20 bars wide, 10 left/right) with gradient fading, indicating significant trades.
Bubbles: Circles above (buy) or below (sell) candles, sized by delta strength.
Debug Labels: Show volume and delta for each heatmap zone if enabled.
Settings
Session Times: Configure start/end times for each session in CEST.
ATR Length/Threshold: Filter neutral candles based on ATR (Average True Range).
Big Trades Volume/Delta Percentile: Set the threshold for significant trades (default 50).
Use Delta Filter: Choose between delta-based or volume-based filtering.
Use Aggressive Factor: Weight large price movements higher (default enabled).
Show Bubbles: Toggle bubbles for big trades.
Minimal Mode: Display only tiny bubbles if enabled.
Show Heatmap: Toggle the gradient heatmap.
Heatmap Contrast: Adjust (0–5) to filter out low-volume zones (lower = more zones).
Show Debug Labels: Display volume/delta for heatmap zones.
Show No Heatmap Zones Warning: Toggle warning for overly strict filters.
Skrypt chroniony
Ten skrypt został opublikowany jako zamknięty kod źródłowy. Można z tego korzystać swobodnie i bez żadnych ograniczeń — więcej informacji znajduje się tutaj.
Wyłączenie odpowiedzialności
Informacje i publikacje nie stanowią i nie powinny być traktowane jako porady finansowe, inwestycyjne, tradingowe ani jakiekolwiek inne rekomendacje dostarczane lub zatwierdzone przez TradingView. Więcej informacji znajduje się w Warunkach użytkowania.