OPEN-SOURCE SCRIPT
Katik Cycle 56 Days
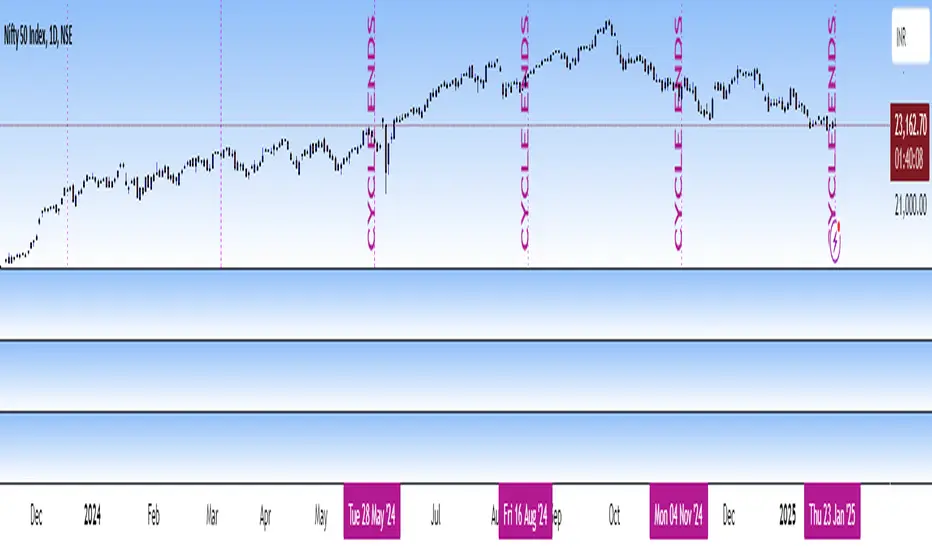
This script plots vertical dotted lines on the chart every 56 trading days, starting from the first bar. It calculates intervals based on the bar_index and draws the lines for both historical and future dates by projecting the lines forward.
The lines are extended across the entire chart height using extend=extend.both, ensuring visibility regardless of chart zoom level. You can customize the interval length using the input box.
Note: Use this only for 1D (Day) candle so that you can find the changes in the trend...
The lines are extended across the entire chart height using extend=extend.both, ensuring visibility regardless of chart zoom level. You can customize the interval length using the input box.
Note: Use this only for 1D (Day) candle so that you can find the changes in the trend...
Skrypt open-source
W zgodzie z duchem TradingView twórca tego skryptu udostępnił go jako open-source, aby użytkownicy mogli przejrzeć i zweryfikować jego działanie. Ukłony dla autora. Korzystanie jest bezpłatne, jednak ponowna publikacja kodu podlega naszym Zasadom serwisu.
Wyłączenie odpowiedzialności
Informacje i publikacje nie stanowią i nie powinny być traktowane jako porady finansowe, inwestycyjne, tradingowe ani jakiekolwiek inne rekomendacje dostarczane lub zatwierdzone przez TradingView. Więcej informacji znajduje się w Warunkach użytkowania.