OPEN-SOURCE SCRIPT
Zaktualizowano Psychological Lines
**The Option Chain Shows Strike Price Levels per Index Option**
- **Bank Nifty Index:** 100-point difference or gap between two strike prices.
- **Nifty 50 Index:** 50-point difference or gap between two strike prices.
- **FinNifty 50 Index:** 50-point difference or gap between two strike prices.
**Importance of These Levels:**
- When prices trade at these levels, the option premium either increases or decreases.
- Round numbers always affect option prices.
- Psychological round numbers have a significant impact and act as support and resistance.
- More strangle or straddle positions are created at these levels.
- More call writers or put writers trade at these levels.
**Benefits of Plotting Levels on Charts:**
- Having levels to plot on the chart is always helpful while trading and aids in taking trade positions accordingly.
**Indicator Features:**
- Helps users with various functionalities.
- Allows users to plot lines as needed and adjust the gap between lines as per requirements or option strikes.
- User input to show the number of lines on the chart.
- Tooltip on each level, indicating the current price (LTP) and the difference in points from the LTP.
- Simple to use.
- User-friendly.
- Enhances trading experience with the help of lines.
---
These adjustments should make the text clearer and more professional. If you need any further changes, feel free to ask!
Informacje o Wersji
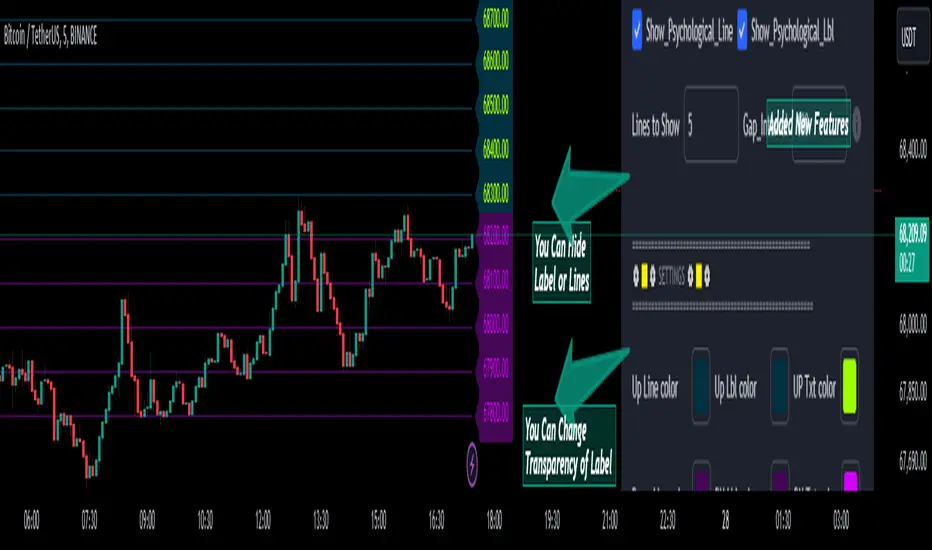
Now that the Script is Updated the overlapping of label & Line issue is solved.Informacje o Wersji
Group & Settings Added ( Updated)Informacje o Wersji
The improved script looks well-organized and feature-rich! Here are a few notable enhancements and additions in the code:
User Input for Customization: The script allows users to customize the number of lines, gap interval, line and label colors, transparency, and line width. This makes it highly adaptable to different charting needs.
Tooltips: You've added tooltips to the labels, which provide detailed information about the lines and their positions relative to the current close price. This is a great feature for better understanding and analysis.
Conditional Display: Lines and labels are drawn based on user input, ensuring that unnecessary elements are not plotted if not needed.
Color and Transparency: Customizable colors and transparency for labels enhance visual clarity and chart readability.
This updated version should provide a cleaner and more informative chart experience. If you have any specific questions or need further improvements, feel free to ask!
Skrypt open-source
W zgodzie z duchem TradingView twórca tego skryptu udostępnił go jako open-source, aby użytkownicy mogli przejrzeć i zweryfikować jego działanie. Ukłony dla autora. Korzystanie jest bezpłatne, jednak ponowna publikacja kodu podlega naszym Zasadom serwisu.
Wyłączenie odpowiedzialności
Informacje i publikacje nie stanowią i nie powinny być traktowane jako porady finansowe, inwestycyjne, tradingowe ani jakiekolwiek inne rekomendacje dostarczane lub zatwierdzone przez TradingView. Więcej informacji znajduje się w Warunkach użytkowania.