OPEN-SOURCE SCRIPT
SRG Fibs Smoothed
PLEASE READ: HOW TO UNDERSTAND HOW THIS INDICATOR WORKS FOR ME!
Why did I code this?
I never know where is the best place to buy
Sometimes I get greedy and just don't want to sell...
I want to protect myself from losses and still be able to make some trades
What does this do?
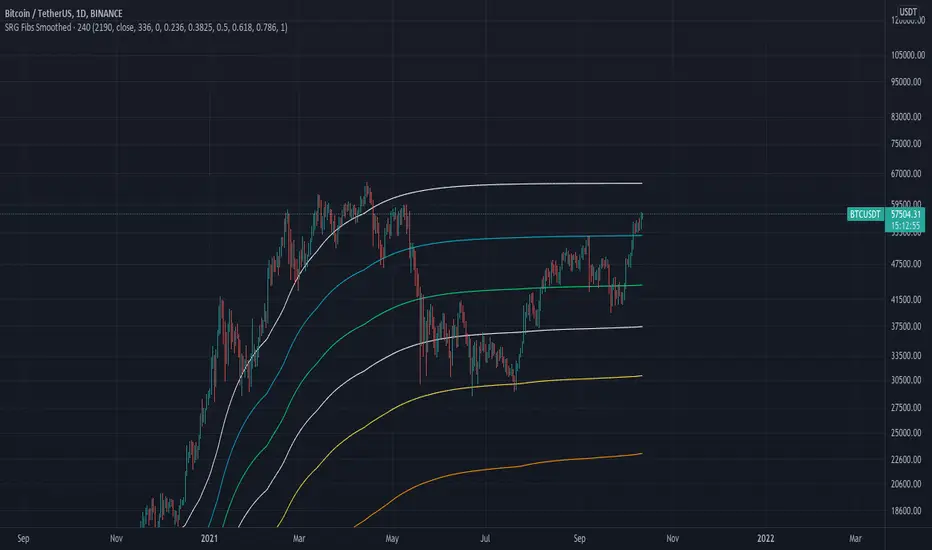
This script plots Fibonacci levels dynamically according to a specified length
It also has a smooting value so it looks a bit more clean (and allows for dynamic trailing stop loss)
Internal Fib levels allow to plot fibonacci levels between each main level (scalpers and day traders should be happy with this)
Fib Projection toggle so we can have "the same behaviour" during aggressive Bull Runs.
How to test this thing?
BTC USD Daily chart
For starters, use the following settings:
- Length: 365 (lookback of a full year)
- Smooth: 56 (8 week period)
- Inter Fib levels: OFF
- Fib projection: OFF
Have a look into the chart and check some support/resistance zones. Also check the behaviour of the indicator during the 2021 Jan -> Mar bull run (we will need it later)
If you like to check different time frames. Use these settings:
- Indicator Timeframe: 4 hours
- Length: 2190 (1 year)
- Smooth: 336 (8 weeks)
- Inter Fib Levels: ON
- Fib Projection: OFF
You can now test the chart using the 2H timeframe to see the movement, and how the Internal Fib levels work
Now as we're getting bullish:
- Indicator Timeframe: 4 hours
- Length: 2190 (1 year)
- Smooth: 336 (8 weeks)
- Inter Fib Levels: OFF
- Fib Projection: ON
You can now check the behaviour of the indicator during the 2021 Jan - Mar Bullrun in the 2H or 4H chart, to see some stop loss magic.
Why did I code this?
I never know where is the best place to buy
Sometimes I get greedy and just don't want to sell...
I want to protect myself from losses and still be able to make some trades
What does this do?
This script plots Fibonacci levels dynamically according to a specified length
It also has a smooting value so it looks a bit more clean (and allows for dynamic trailing stop loss)
Internal Fib levels allow to plot fibonacci levels between each main level (scalpers and day traders should be happy with this)
Fib Projection toggle so we can have "the same behaviour" during aggressive Bull Runs.
How to test this thing?
BTC USD Daily chart
For starters, use the following settings:
- Length: 365 (lookback of a full year)
- Smooth: 56 (8 week period)
- Inter Fib levels: OFF
- Fib projection: OFF
Have a look into the chart and check some support/resistance zones. Also check the behaviour of the indicator during the 2021 Jan -> Mar bull run (we will need it later)
If you like to check different time frames. Use these settings:
- Indicator Timeframe: 4 hours
- Length: 2190 (1 year)
- Smooth: 336 (8 weeks)
- Inter Fib Levels: ON
- Fib Projection: OFF
You can now test the chart using the 2H timeframe to see the movement, and how the Internal Fib levels work
Now as we're getting bullish:
- Indicator Timeframe: 4 hours
- Length: 2190 (1 year)
- Smooth: 336 (8 weeks)
- Inter Fib Levels: OFF
- Fib Projection: ON
You can now check the behaviour of the indicator during the 2021 Jan - Mar Bullrun in the 2H or 4H chart, to see some stop loss magic.
Skrypt open-source
W zgodzie z duchem TradingView twórca tego skryptu udostępnił go jako open-source, aby użytkownicy mogli przejrzeć i zweryfikować jego działanie. Ukłony dla autora. Korzystanie jest bezpłatne, jednak ponowna publikacja kodu podlega naszym Zasadom serwisu.
Wyłączenie odpowiedzialności
Informacje i publikacje nie stanowią i nie powinny być traktowane jako porady finansowe, inwestycyjne, tradingowe ani jakiekolwiek inne rekomendacje dostarczane lub zatwierdzone przez TradingView. Więcej informacji znajduje się w Warunkach użytkowania.