OPEN-SOURCE SCRIPT
Zaktualizowano Multi-Timeframe Stoch RSI Dashboard
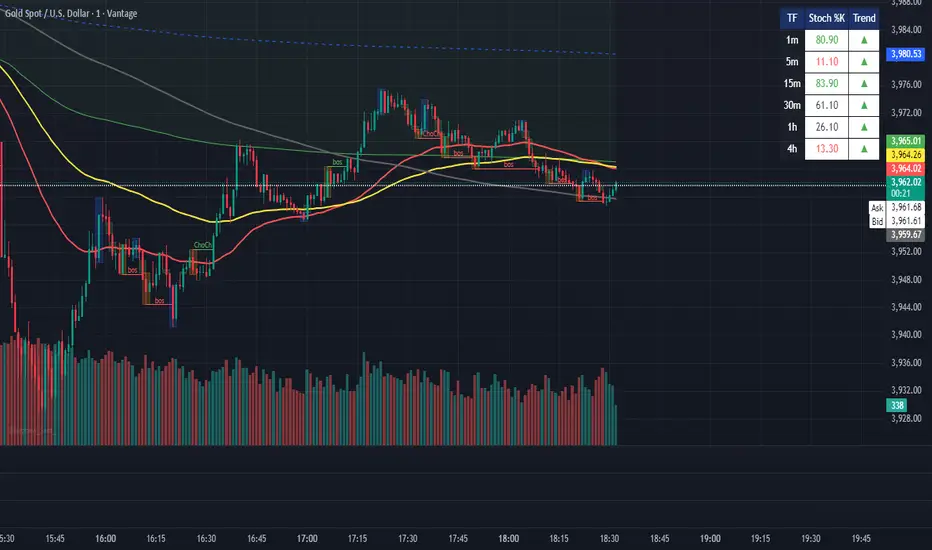
Shows the Stoch RSI values for different timeframes in a box on the top right corner.
1m
5m
15m
30m
1h
4h
Above 80 = green
Below 20 = red
Black = between 20 and 80.
1m
5m
15m
30m
1h
4h
Above 80 = green
Below 20 = red
Black = between 20 and 80.
Informacje o Wersji
Version 2 where values are correct when switching timeframes.Informacje o Wersji
Added trend arrows to show the direction of the trend of the Stoch RSI.Skrypt open-source
W duchu TradingView twórca tego skryptu udostępnił go jako open-source, aby traderzy mogli analizować i weryfikować jego funkcjonalność. Brawo dla autora! Możesz korzystać z niego za darmo, ale pamiętaj, że ponowna publikacja kodu podlega naszym Zasadom Społeczności.
Wyłączenie odpowiedzialności
Informacje i publikacje przygotowane przez TradingView lub jego użytkowników, prezentowane na tej stronie, nie stanowią rekomendacji ani porad handlowych, inwestycyjnych i finansowych i nie powinny być w ten sposób traktowane ani wykorzystywane. Więcej informacji na ten temat znajdziesz w naszym Regulaminie.
Skrypt open-source
W duchu TradingView twórca tego skryptu udostępnił go jako open-source, aby traderzy mogli analizować i weryfikować jego funkcjonalność. Brawo dla autora! Możesz korzystać z niego za darmo, ale pamiętaj, że ponowna publikacja kodu podlega naszym Zasadom Społeczności.
Wyłączenie odpowiedzialności
Informacje i publikacje przygotowane przez TradingView lub jego użytkowników, prezentowane na tej stronie, nie stanowią rekomendacji ani porad handlowych, inwestycyjnych i finansowych i nie powinny być w ten sposób traktowane ani wykorzystywane. Więcej informacji na ten temat znajdziesz w naszym Regulaminie.