PROTECTED SOURCE SCRIPT
FindAlphas_Volume

Hello traders,
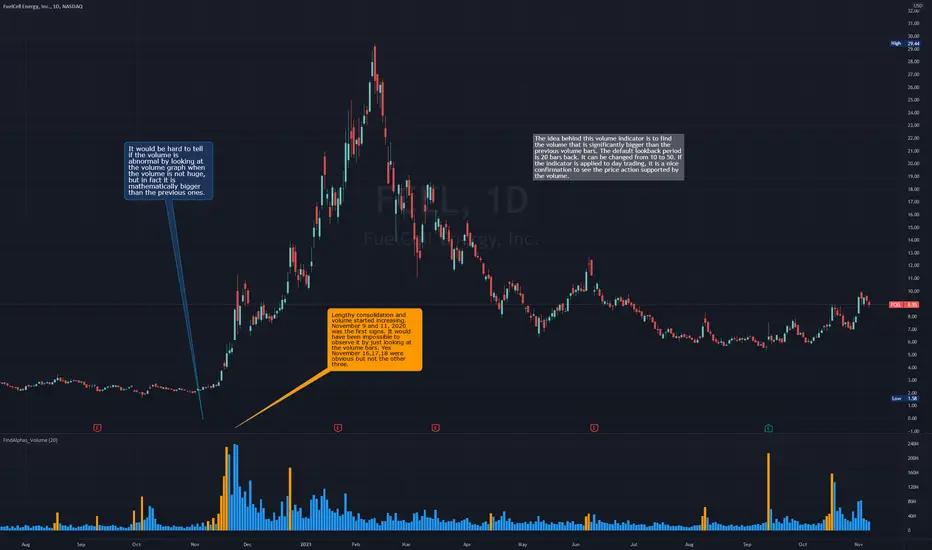
As you know, in trading two things are important: Price Action and Volume. When a stock is bullish and there is support with the volume, it is a good thing. Sometimes a stock will be accumulated before anyone gets to know about it. A slight increase in the volume might not get noticed, unless the volume is calculated to check for an increase. The script will calculate each volume bar in real time and will compare it to the previous bars. If there is a significant increase in the volume, it will be spotted, and the color will change to inform the trader.
There are couple of user input fields for modifications.
1- The lookback period. Default is set to 20, but could be changed from 10 to 50. This will affect how the script is going to calculate the abnormality in the volume.
2- The other one is to see the volume as a histogram or not.
3- Volume color
4- Alpha Volume color
5- Histogram color
I hope you will find it useful
Skrypt chroniony
Ten skrypt został opublikowany jako zamknięty kod źródłowy. Można z tego korzystać swobodnie i bez żadnych ograniczeń — więcej informacji znajduje się tutaj.
Wyłączenie odpowiedzialności
Informacje i publikacje nie stanowią i nie powinny być traktowane jako porady finansowe, inwestycyjne, tradingowe ani jakiekolwiek inne rekomendacje dostarczane lub zatwierdzone przez TradingView. Więcej informacji znajduje się w Warunkach użytkowania.