OPEN-SOURCE SCRIPT
Cooltoyz: market shaker v1.0
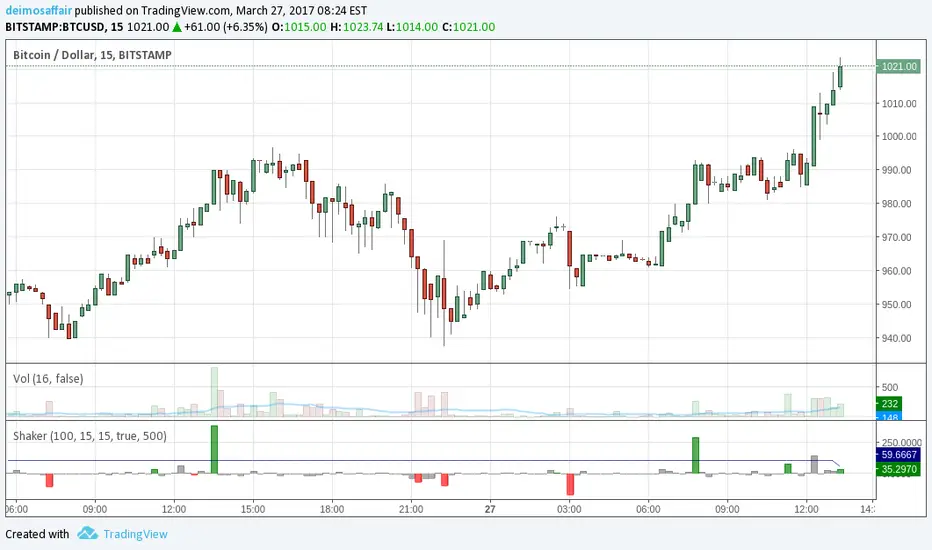
Panicking over a big ass candle? wondering what's happening on a flat market? Despair no more, this indicator could help with that :)
The market Shaker calculates the price differences, and weights them with the volume used for the move. This volume is not the plain value, but a measure of the past X volume candles.
Examples:
price moves 3%, but with a volume of only ~80% of last candles. looks like weak move
price moves 0.4%, but the volume was a massive 220% bigger than last candles. something happened, even if the market absorbed it all, better pay attention.
in each case, the shaker indicator makes the calculated value bigger/smaller to account for the volume weight of the move.
It's also i real time, the current candle weight is considered on how much time it remains to close. Example, on the 1H chart, if the last candle is 45min to close, the values for the volume are weighted to 25%, since is only 15min "old", while all the other candles are 1h, so the candle is only 25% of it's time to close.
The indicator options has the arguments required to tune the indicator, the candles minutes must match the chart, or the results go crazy.
Skrypt open-source
W zgodzie z duchem TradingView twórca tego skryptu udostępnił go jako open-source, aby użytkownicy mogli przejrzeć i zweryfikować jego działanie. Ukłony dla autora. Korzystanie jest bezpłatne, jednak ponowna publikacja kodu podlega naszym Zasadom serwisu.
Wyłączenie odpowiedzialności
Informacje i publikacje nie stanowią i nie powinny być traktowane jako porady finansowe, inwestycyjne, tradingowe ani jakiekolwiek inne rekomendacje dostarczane lub zatwierdzone przez TradingView. Więcej informacji znajduje się w Warunkach użytkowania.