OPEN-SOURCE SCRIPT
Zaktualizowano Peak and Trough Tracker by Mustafa KAPUZ
Peak and Trough Tracker
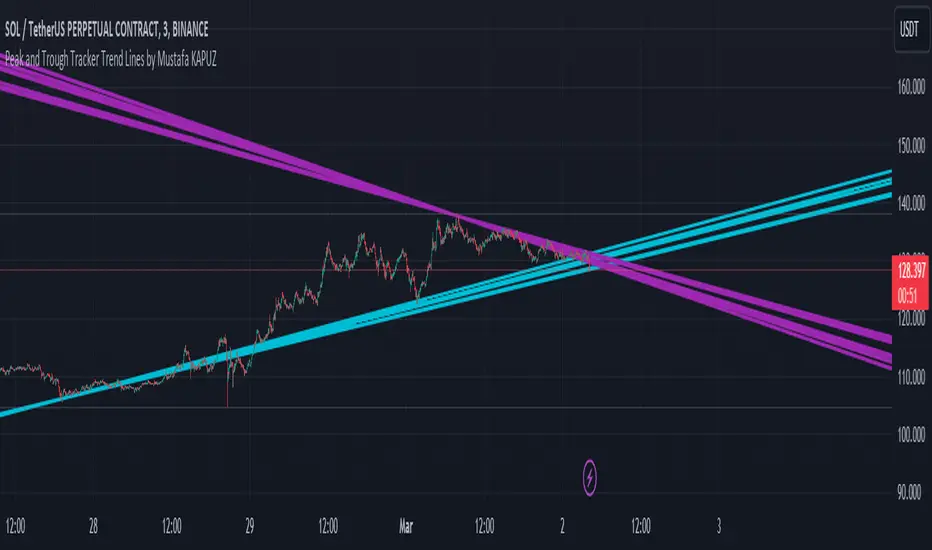
This indicator identifies the highest and lowest prices reached in two user-defined time periods. It then draws two lines connecting these peak and trough points. The purple line represents the connection between the highest prices, while the aqua line represents the relationship between the lowest prices. Both lines extend into the future and past, providing insights into potential support and resistance levels.
How to Use:
This tool helps visually understand the market's key turning points and adjust your investment strategy based on these insights.
Zirve ve Dip Noktaları İzleyici
Bu indikatör, kullanıcı tarafından belirlenen iki zaman periyodunda piyasanın ulaştığı en yüksek ve en düşük fiyatları tespit eder. Ardından, bu zirve ve dip noktalarını birleştiren iki çizgi çizer. Mor çizgi, en yüksek fiyatlar arasındaki bağlantıyı gösterirken; aqua çizgi, en düşük fiyatlar arasındaki ilişkiyi temsil eder. Her iki çizgi de geleceğe ve geçmişe doğru uzanarak, potansiyel destek ve direnç seviyeleri hakkında fikir verir.
Kullanımı:
İndikatörü grafik üzerine ekleyin.
İki zaman periyodu girin.
Zirve ve dip noktalarını birleştiren çizgilerin analizini yapın.
Bu araç, piyasanın önemli dönüm noktalarını görsel olarak anlamanıza ve yatırım stratejinizi bu bilgilere göre ayarlamanıza yardımcı olur.
This indicator identifies the highest and lowest prices reached in two user-defined time periods. It then draws two lines connecting these peak and trough points. The purple line represents the connection between the highest prices, while the aqua line represents the relationship between the lowest prices. Both lines extend into the future and past, providing insights into potential support and resistance levels.
How to Use:
- [1*]Add the indicator to your chart.
- [2*]Enter two time periods.
- [3*]Analyze the lines connecting peak and trough points.
This tool helps visually understand the market's key turning points and adjust your investment strategy based on these insights.
Zirve ve Dip Noktaları İzleyici
Bu indikatör, kullanıcı tarafından belirlenen iki zaman periyodunda piyasanın ulaştığı en yüksek ve en düşük fiyatları tespit eder. Ardından, bu zirve ve dip noktalarını birleştiren iki çizgi çizer. Mor çizgi, en yüksek fiyatlar arasındaki bağlantıyı gösterirken; aqua çizgi, en düşük fiyatlar arasındaki ilişkiyi temsil eder. Her iki çizgi de geleceğe ve geçmişe doğru uzanarak, potansiyel destek ve direnç seviyeleri hakkında fikir verir.
Kullanımı:
İndikatörü grafik üzerine ekleyin.
İki zaman periyodu girin.
Zirve ve dip noktalarını birleştiren çizgilerin analizini yapın.
Bu araç, piyasanın önemli dönüm noktalarını görsel olarak anlamanıza ve yatırım stratejinizi bu bilgilere göre ayarlamanıza yardımcı olur.
Informacje o Wersji
Language changesInformacje o Wersji
Language Changes v2Skrypt open-source
W zgodzie z duchem TradingView twórca tego skryptu udostępnił go jako open-source, aby użytkownicy mogli przejrzeć i zweryfikować jego działanie. Ukłony dla autora. Korzystanie jest bezpłatne, jednak ponowna publikacja kodu podlega naszym Zasadom serwisu.
Wyłączenie odpowiedzialności
Informacje i publikacje nie stanowią i nie powinny być traktowane jako porady finansowe, inwestycyjne, tradingowe ani jakiekolwiek inne rekomendacje dostarczane lub zatwierdzone przez TradingView. Więcej informacji znajduje się w Warunkach użytkowania.
Skrypt open-source
W zgodzie z duchem TradingView twórca tego skryptu udostępnił go jako open-source, aby użytkownicy mogli przejrzeć i zweryfikować jego działanie. Ukłony dla autora. Korzystanie jest bezpłatne, jednak ponowna publikacja kodu podlega naszym Zasadom serwisu.
Wyłączenie odpowiedzialności
Informacje i publikacje nie stanowią i nie powinny być traktowane jako porady finansowe, inwestycyjne, tradingowe ani jakiekolwiek inne rekomendacje dostarczane lub zatwierdzone przez TradingView. Więcej informacji znajduje się w Warunkach użytkowania.