OPEN-SOURCE SCRIPT
EMA Trend Band with Buy/Sell Signals
## What This Indicator Does
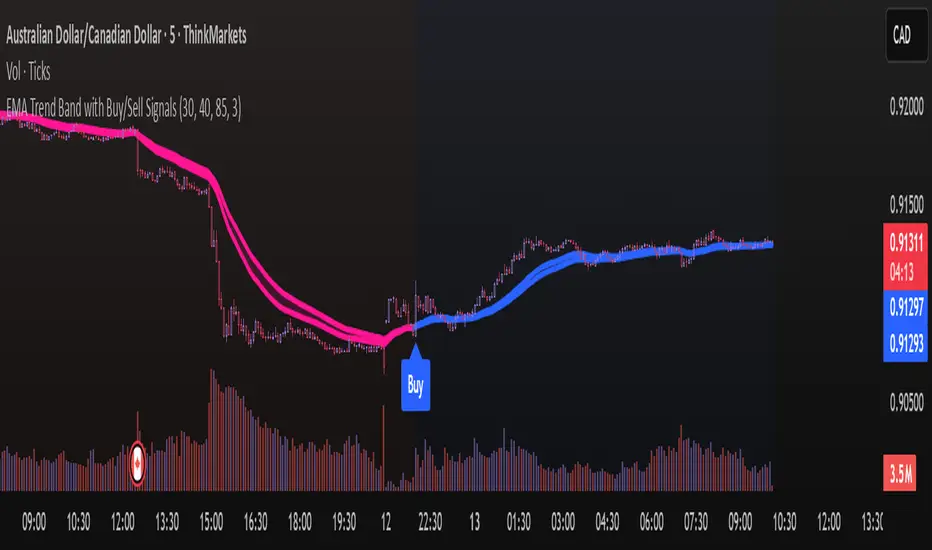
The **EMA Trend Band with Buy/Sell Signals** is a powerful visual trend-following indicator that combines two exponential moving averages (30-period fast EMA and 40-period slow EMA) to identify market direction and generate clear trading signals.[1][3]
### Core Components
**Dual EMA System**: The indicator uses a fast EMA (30) and slow EMA (40) to track short-term and long-term price momentum simultaneously. The fast EMA reacts quickly to price changes, while the slow EMA filters out market noise and confirms the overall trend
**Color-Coded Trend Band**: Both EMAs change color dynamically based on trend direction - blue when bullish (fast EMA above slow EMA) and pink when bearish (fast EMA below slow EMA). The filled area between the two EMAs creates a visual "trend channel" that makes it easy to identify market direction at a glance.
**Buy/Sell Signal Generation**: When the fast EMA crosses above the slow EMA, a BUY signal appears with a blue label and small triangle marker. When the fast EMA crosses below the slow EMA, a SELL signal appears with a red label and triangle marker.
**Background Highlighting**: The chart background has a subtle blue or red tint matching the current trend, providing additional visual confirmation.
**Built-in Alerts**: Three alert conditions notify you of buy signals, sell signals, or any crossover event, allowing you to monitor multiple charts without watching them constantly.
## How to Use This Indicator Effectively
### Entry Rules
**Long (Buy) Entry**: Enter a long position when you see the blue BUY label appear below a candle, which occurs when the 30 EMA crosses above the 40 EMA. Confirm the signal by ensuring the price is above both EMAs and the trend band has turned blue.
**Short (Sell) Entry**: Enter a short position when you see the red SELL label appear above a candle, which occurs when the 30 EMA crosses below the 40EMA. Confirm the signal by ensuring the price is below both EMAs and the trend band has turned pink.
**Additional Confirmation**: For higher probability trades, wait for the price to close above/below both EMAs before entering, rather than entering on the crossover candle itself. This reduces false signals in choppy markets.
### Trade Management
**Trend Following**: Once in a trade, stay in the position as long as the EMAs maintain their color (blue for longs, pink for shorts). The filled band acts as a dynamic support/resistance zone.
**Exit Strategy**: Exit your long position when the EMAs turn pink (sell signal), or exit your short position when the EMAs turn blue (buy signal). Alternatively, use a trailing stop below/above the fast EMA for tighter risk management.
**Stop Loss Placement**: Place your stop loss below the slow EMA (40) for long positions, or above the slow EMA for short positions. This gives the trade room to breathe while protecting against major reversals.
### Filtering False Signals
**Avoid Choppy Markets**: The indicator works best in trending markets and can generate false signals during sideways consolidation. When both EMAs are flat and price oscillates between them, stay out of the market.
**Combine with Higher Timeframes**: Check the trend on a higher timeframe before taking signals on lower timeframes. For example, if trading on 15-minute charts, ensure the 1-hour chart shows the same trend direction.
**Volume Confirmation**: Use volume to confirm signal strength - stronger volume on crossover candles typically leads to more reliable trends.
## Best Timeframes for Different Trading Styles
### Scalping (1-Minute to 5-Minute Charts)
**Settings**: Keep default 30/40 EMA or adjust to 20/100 for faster signals
**Best for**: Highly volatile cryptocurrencies like BTC, ETH during active trading sessions (morning US/evening Asian overlap)
**Advantages**: Quick signals, multiple trades per day, catches micro-trends
**Disadvantages**: More false signals, requires constant monitoring, high stress
**Recommendation**: Use 5-minute charts with this indicator for crypto scalping - it provides the best balance between signal frequency and reliability.
### Day Trading (15-Minute to 1-Hour Charts)
**Settings**: Default 30/40 works perfectly
**Best for**: Forex pairs (EUR/USD, GBP/USD), major crypto pairs, index futures
**Advantages**: Fewer false signals than lower timeframes, captures intraday trends, good risk-reward ratios
**Disadvantages**: Requires several hours of monitoring, 2-4 trades per day maximum
**Recommendation**: **15-minute and 1-hour charts are the OPTIMAL timeframes for this indicator**. The 1-hour timeframe provides the best balance of signal accuracy and trade frequency for most traders.
### Swing Trading (4-Hour to Daily Charts)
**Settings**: Default 30/100 or extend to 50/200 for stronger trends
**Best for**: Stocks, crypto spot trading, major forex pairs, commodities
**Advantages**: Highest signal reliability, less screen time, captures major moves, lower stress
**Disadvantages**: Fewer trading opportunities, larger stop losses required, slower signals
**Recommendation**: Use 4-hour charts for active swing trading or daily charts for position trading. The 4-hour timeframe is excellent for cryptocurrency swing trading with this indicator.
## Recommended Best Timeframe Overall
### For Cryptocurrency Trading (Your Primary Interest)
**1-Hour Chart**: This is the BEST all-around timeframe for this EMA band indicator when trading crypto on Binance. It provides:
- 2-5 quality signals per week per pair
- Strong trend filtering with minimal false signals
- Manageable stop losses (typically 1-2% of position)
- Good risk-reward ratios (2:1 to 4:1 average)
- Reasonable monitoring requirements (check every few hours)
**Alternative for Active Trading**: 15-minute charts if you want more frequent signals and can monitor markets actively during your trading sessions.
### For Forex Trading
**1-Hour Chart**: Also optimal for EUR/USD and other major pairs during London/New York sessions
### For Stocks
**Daily Chart**: Best for swing trading individual stocks with this indicator
## Pro Tips for Maximum Effectiveness
**Multiple Timeframe Confirmation**: Before taking a 15-minute signal, check that the 1-hour trend band shows the same color. This dramatically increases win rate.
**Trade in the Direction of the Larger Trend**: Use daily charts to identify the major trend, then take only signals in that direction on lower timeframes.
**Avoid Trading During Major News Events**: EMAs can give false signals during high-impact economic announcements as price whipsaws.
**Use with Support/Resistance**: Combine EMA crossovers with key support and resistance levels for high-probability setups.
**Paper Trade First**: Test this indicator on a demo account for at least 20-30 trades before risking real money to understand its behavior on your preferred timeframe and instruments.[7]
Skrypt open-source
W duchu TradingView twórca tego skryptu udostępnił go jako open-source, aby traderzy mogli analizować i weryfikować jego funkcjonalność. Brawo dla autora! Możesz korzystać z niego za darmo, ale pamiętaj, że ponowna publikacja kodu podlega naszym Zasadom Społeczności.
Wyłączenie odpowiedzialności
Informacje i publikacje przygotowane przez TradingView lub jego użytkowników, prezentowane na tej stronie, nie stanowią rekomendacji ani porad handlowych, inwestycyjnych i finansowych i nie powinny być w ten sposób traktowane ani wykorzystywane. Więcej informacji na ten temat znajdziesz w naszym Regulaminie.