OPEN-SOURCE SCRIPT
Prior sessions High/Low/Mid
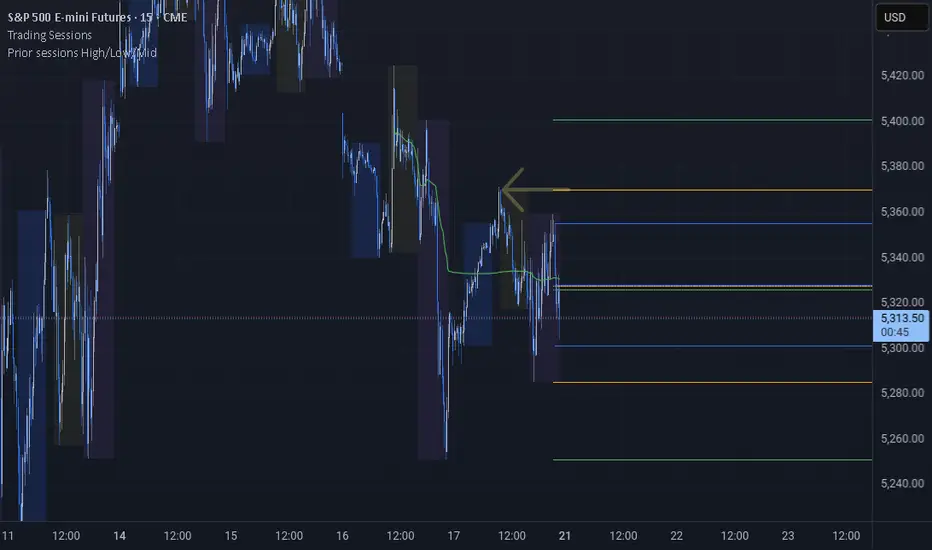
This indicator highlights the High, Low, and Midpoint of the most recently completed trading sessions. It helps traders visualize key price levels from the previous session that often act as support, resistance, or reaction zones.
It draws horizontal lines for the high and low of the last completed session, as well as the midpoint, which is calculated as the average of the high and low. These lines extend to the right side of the chart, remaining visible as reference levels throughout the day.
You can independently enable or disable the Tokyo, London, and New York sessions depending on your preferences. Each session has adjustable start and end times, as well as time zone settings, so you can align them accurately with your trading strategy.
This indicator is particularly useful for intraday and swing traders who use session-based levels to define market structure, bias, or areas of interest. Session highs and lows often align with institutional activity and can be key turning points in price action.
Please note that this script is designed to be used only on intraday timeframes such as 1-minute to 4-hour charts. It will not function on daily or higher timeframes.
Skrypt open-source
W zgodzie z duchem TradingView twórca tego skryptu udostępnił go jako open-source, aby użytkownicy mogli przejrzeć i zweryfikować jego działanie. Ukłony dla autora. Korzystanie jest bezpłatne, jednak ponowna publikacja kodu podlega naszym Zasadom serwisu.
Wyłączenie odpowiedzialności
Informacje i publikacje nie stanowią i nie powinny być traktowane jako porady finansowe, inwestycyjne, tradingowe ani jakiekolwiek inne rekomendacje dostarczane lub zatwierdzone przez TradingView. Więcej informacji znajduje się w Warunkach użytkowania.