OPEN-SOURCE SCRIPT
Zaktualizowano [NLR] - SweetSpot Zones
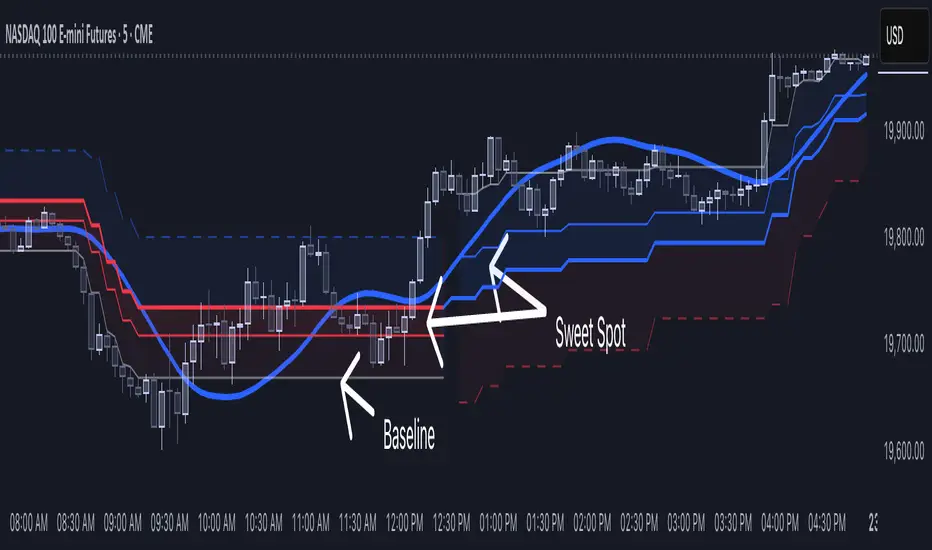
The Sweet Spot Zone helps you find the best spots to enter a trade, inspired by the "Follow Line Indicator" by Dreadblitz (big thanks to him!). It draws a colored zone on your chart to show ideal entry points, with a Base Point to keep you on track.
What It Does
How to Use It
Settings
Credits
Inspired by the "Follow Line Indicator" by Dreadblitz—check out his work for more great ideas!
What It Does
- Blue Zone: Uptrend—buy when the price dips into the zone.
- Red Zone: Downtrend—sell or short when the price climbs into the zone.
- Base Point: A gray line showing the key level the zone is built on.
How to Use It
- Look for the colored zone:
- Blue: Buy if the price dips into the zone but stays above the Base Point.
- Red: Sell/short if the price climbs into the zone but stays below the Base Point. - Important: Avoid entering trade beyond base point - you might see low returns and face big drawdowns.
- Confirm with other signals (like RSI/MACD) before entering.
Settings
- ATR Length (10): How far back it looks to calculate price movement.
- ATR Multiplier (2.5): How wide the zone is.
- Error Margin (5.0): Keeps the zone steady during small price wiggles.
- Uptrend/Downtrend Colors: Change the zone colors if you’d like!
Credits
Inspired by the "Follow Line Indicator" by Dreadblitz—check out his work for more great ideas!
Informacje o Wersji
Added other side zone to show possible area where price action may goSkrypt open-source
W zgodzie z duchem TradingView twórca tego skryptu udostępnił go jako open-source, aby użytkownicy mogli przejrzeć i zweryfikować jego działanie. Ukłony dla autora. Korzystanie jest bezpłatne, jednak ponowna publikacja kodu podlega naszym Zasadom serwisu.
Wyłączenie odpowiedzialności
Informacje i publikacje nie stanowią i nie powinny być traktowane jako porady finansowe, inwestycyjne, tradingowe ani jakiekolwiek inne rekomendacje dostarczane lub zatwierdzone przez TradingView. Więcej informacji znajduje się w Warunkach użytkowania.
Skrypt open-source
W zgodzie z duchem TradingView twórca tego skryptu udostępnił go jako open-source, aby użytkownicy mogli przejrzeć i zweryfikować jego działanie. Ukłony dla autora. Korzystanie jest bezpłatne, jednak ponowna publikacja kodu podlega naszym Zasadom serwisu.
Wyłączenie odpowiedzialności
Informacje i publikacje nie stanowią i nie powinny być traktowane jako porady finansowe, inwestycyjne, tradingowe ani jakiekolwiek inne rekomendacje dostarczane lub zatwierdzone przez TradingView. Więcej informacji znajduje się w Warunkach użytkowania.