OPEN-SOURCE SCRIPT
Same Day Past Candles
Same-Day Past Candles
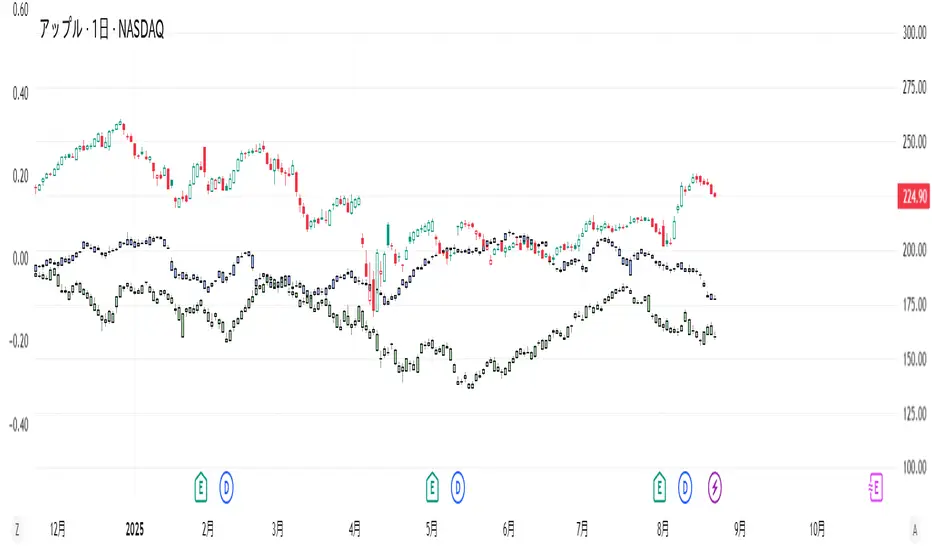
This indicator is a tool that plots the shapes of the candles from the same date one and two years ago directly on the current chart. By visually comparing past price movements, it can help you analyze seasonality and cyclical patterns.

Key Features
Plots Past Candles: Displays candles from the same date one and two years ago on your current chart.
Toggle Visibility: You can individually turn the display of the "1 year ago candle" and "2 years ago candle" on or off in the indicator's settings.
Candle Shape: The open, high, low, and close prices of the past candles are plotted, scaled to the current price range.
How to Use
Add this indicator to a daily chart for best results. The plotted candles are slightly offset upwards so they don't overlap with the current price, making it easier to compare the shape of the past candles with the current chart movement.
Visually checking how specific past price changes are reflected on the same day this year can provide insights for your trading strategy.
[Important Notice]
I do not speak English at all. Please understand that if you send me a message, I may not be able to reply, or my reply may have a different meaning. Thank you for your understanding.
This indicator is a tool that plots the shapes of the candles from the same date one and two years ago directly on the current chart. By visually comparing past price movements, it can help you analyze seasonality and cyclical patterns.
Key Features
Plots Past Candles: Displays candles from the same date one and two years ago on your current chart.
Toggle Visibility: You can individually turn the display of the "1 year ago candle" and "2 years ago candle" on or off in the indicator's settings.
Candle Shape: The open, high, low, and close prices of the past candles are plotted, scaled to the current price range.
How to Use
Add this indicator to a daily chart for best results. The plotted candles are slightly offset upwards so they don't overlap with the current price, making it easier to compare the shape of the past candles with the current chart movement.
Visually checking how specific past price changes are reflected on the same day this year can provide insights for your trading strategy.
[Important Notice]
I do not speak English at all. Please understand that if you send me a message, I may not be able to reply, or my reply may have a different meaning. Thank you for your understanding.
Skrypt open-source
W zgodzie z duchem TradingView twórca tego skryptu udostępnił go jako open-source, aby użytkownicy mogli przejrzeć i zweryfikować jego działanie. Ukłony dla autora. Korzystanie jest bezpłatne, jednak ponowna publikacja kodu podlega naszym Zasadom serwisu.
The Leap 1000位以内2回
The Leap Top 1000 Rank (x2), currently Top 1500.
(Mostly luck, though!)
AI Assessment: A Professional Whose Obsession Has Evolved into Instinct
だそーです
The Leap Top 1000 Rank (x2), currently Top 1500.
(Mostly luck, though!)
AI Assessment: A Professional Whose Obsession Has Evolved into Instinct
だそーです
Wyłączenie odpowiedzialności
Informacje i publikacje nie stanowią i nie powinny być traktowane jako porady finansowe, inwestycyjne, tradingowe ani jakiekolwiek inne rekomendacje dostarczane lub zatwierdzone przez TradingView. Więcej informacji znajduje się w Warunkach użytkowania.