OPEN-SOURCE SCRIPT
Trend Intensity
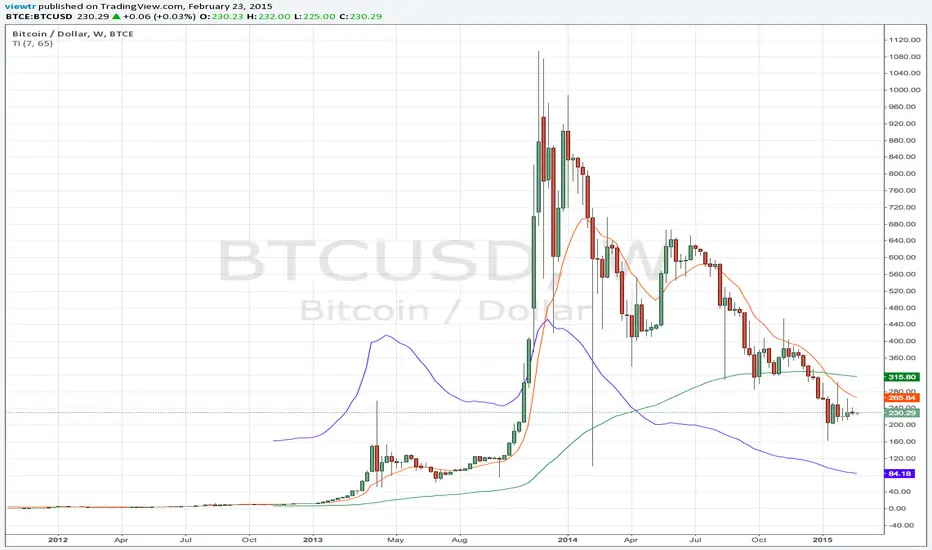
The Trend Intensity indicator measures the strength of the trend. Trend intensity tells us whether we are in an up or downtrend.
Ex:
A TI value of 150 means that the 7 day moving average is currently 50% above the 65 day moving average. This tells us that prices were moving up quickly in recent history.
A TI value of 80 tells us that the 7 day moving average is currently 20% below the 65 day moving average. This tells us that prices were moving down in recent history.
Skrypt open-source
W zgodzie z duchem TradingView twórca tego skryptu udostępnił go jako open-source, aby użytkownicy mogli przejrzeć i zweryfikować jego działanie. Ukłony dla autora. Korzystanie jest bezpłatne, jednak ponowna publikacja kodu podlega naszym Zasadom serwisu.
Wyłączenie odpowiedzialności
Informacje i publikacje nie stanowią i nie powinny być traktowane jako porady finansowe, inwestycyjne, tradingowe ani jakiekolwiek inne rekomendacje dostarczane lub zatwierdzone przez TradingView. Więcej informacji znajduje się w Warunkach użytkowania.