OPEN-SOURCE SCRIPT
Indicator: Derivative Oscillator
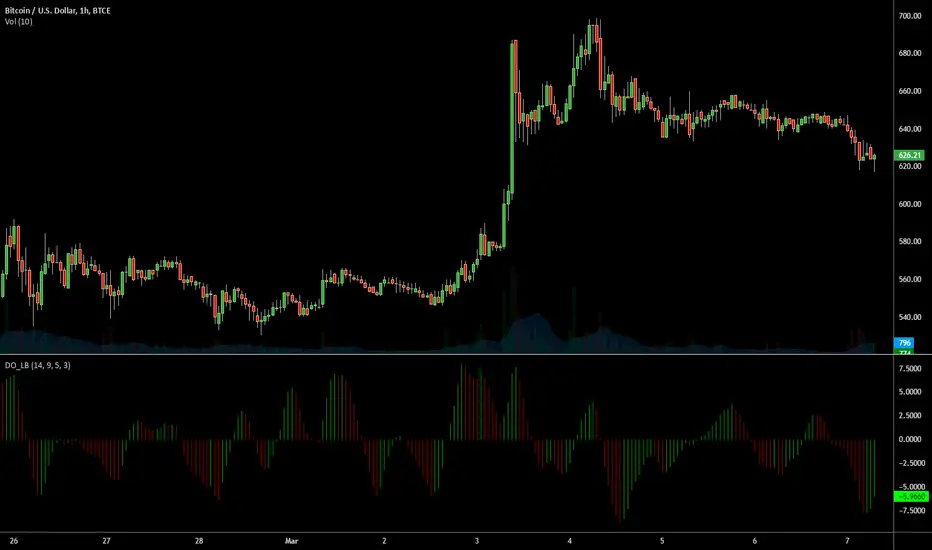
Constance Brown's Derivative Oscillator was published in her book "Technical Analysis for the Trading Professional".
The oscillator uses a 14-period RSI. The RSI is then double smoothed with exponential moving averages. The default settings for the smoothing periods are 5 and 3.
In a second step a signal line is generated from the smoothed RSI by calculating a simple moving average with a period of 9.
The Derivative Oscillator is calculated as the difference between the smoothed RSI and the signal line and displayed as histogram.
All the values are configurable.
Skrypt open-source
W zgodzie z duchem TradingView twórca tego skryptu udostępnił go jako open-source, aby użytkownicy mogli przejrzeć i zweryfikować jego działanie. Ukłony dla autora. Korzystanie jest bezpłatne, jednak ponowna publikacja kodu podlega naszym Zasadom serwisu.
List of my free indicators: bit.ly/1LQaPK8
List of my indicators at Appstore: blog.tradingview.com/?p=970
List of my indicators at Appstore: blog.tradingview.com/?p=970
Wyłączenie odpowiedzialności
Informacje i publikacje nie stanowią i nie powinny być traktowane jako porady finansowe, inwestycyjne, tradingowe ani jakiekolwiek inne rekomendacje dostarczane lub zatwierdzone przez TradingView. Więcej informacji znajduje się w Warunkach użytkowania.