OPEN-SOURCE SCRIPT
Zaktualizowano Time Frame Color Classifier
Time Frame Colour Classifier
A professional Pine Script indicator that provides instant visual identification of trading sessions through intelligent colour-coded backgrounds.
Key Features
📅 Daily Session Colours
- Monday: Green | Tuesday: Blue | Wednesday: Yellow | Thursday: Red | Friday: Purple
📊 Weekly Classification
- Week 1-5 : Colour-coded by week of the month using the same colour scheme
## How It Works
Intraday Charts (1min-4H) : Shows daily colours - every candle on Monday displays green background, Tuesday shows blue, etc.
Daily/Weekly Charts : Switches to weekly colours - all days in Week 1 show green, Week 2 shows blue, etc.
Professional Applications
✅ Multi-Timeframe Analysis : Seamlessly switch between timeframes whilst maintaining visual context
✅ Session Recognition : Instantly identify which trading day you're analysing
✅ Pattern Analysis : Spot recurring patterns on specific days of the week
✅ Strategy Development : Incorporate temporal factors into trading strategies
✅ Performance Attribution : Correlate results with specific trading sessions
Customisation Options
- Toggle daily/weekly colours on/off
- Fully customisable colour schemes
- Adjustable background transparency
- Optional day labels
Technical Details
- Pine Script v5for optimal performance
- Automatic timeframe detection - no manual configuration required
- Minimal resource usage - won't slow down your charts
- Works on all chart types and timeframes
Perfect For
- Day traders switching between multiple timeframes
- Swing traders analysing weekly patterns
- Algorithmic strategy development
- Multi-timeframe market analysis
- Trading education and research
---
Developed by WYCKOFFNAWAF
Transform your chart analysis with visual timeframe clarity
Informacje o Wersji
UPDATE: Added horizontal opening lines feature! Now displays high and low lines from the opening candle of each timeframe period. Fully customisable with colour, style, and extension options. Lines auto-reset for new periods - brilliant for support and resistance analysis!Informacje o Wersji
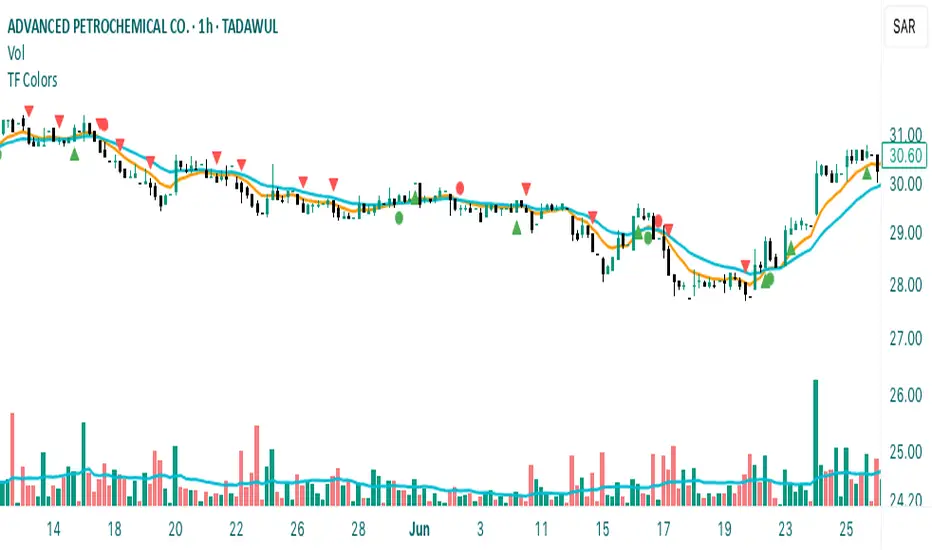
Refined EMA Crossovers: Smaller green/red dots now precisely mark bullish (EMA9 above EMA21) and bearish (EMA9 below EMA21) Exponential Moving Average crossovers.Smart Opening Range Breakout Signals:
A tiny green triangle appears below the first candle breaking the opening high, if the close is above both EMAs.
A tiny red triangle appears above the first candle breaking the opening low, if the close is below both EMAs.
Optional Background Colour: Background colours are now off by default, toggleable in settings.
Skrypt open-source
W zgodzie z duchem TradingView twórca tego skryptu udostępnił go jako open-source, aby użytkownicy mogli przejrzeć i zweryfikować jego działanie. Ukłony dla autora. Korzystanie jest bezpłatne, jednak ponowna publikacja kodu podlega naszym Zasadom serwisu.
Wyłączenie odpowiedzialności
Informacje i publikacje nie stanowią i nie powinny być traktowane jako porady finansowe, inwestycyjne, tradingowe ani jakiekolwiek inne rekomendacje dostarczane lub zatwierdzone przez TradingView. Więcej informacji znajduje się w Warunkach użytkowania.