PROTECTED SOURCE SCRIPT
Zaktualizowano 4-EMA Trend

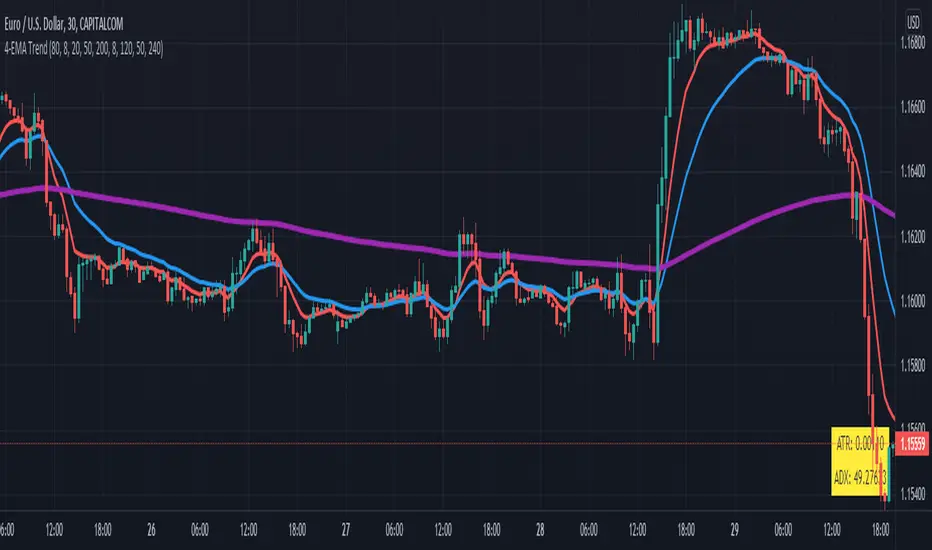
This indicator can be used to visualize when price is above or below special exponential moving averages (8, 21, 50 and 200) that are also displayed on the chart. A green or red background is plotted then, that can be followed as a trend. You can define the amount of risk (e.g. in $) and the number of previous bars that will be used to calculate the stop loss. For the stop loss a label is shown (long or short) that displays the quantity to buy or sell for your defined risk. It is recommend to use the indicator in combination with my Stochastic & RSI (see chart) to enter trades long or short when stochastic is overbought or oversold and RSI above or below 50.
 US100
US100
Informacje o Wersji
Update trend indication: ema8 has to be above / below slower emaInformacje o Wersji
EMA description and length adjustedInformacje o Wersji
Show stop loss buy or sell depending price above or below slowest EMAInformacje o Wersji
SMA 40 added as special pullback indicatorInformacje o Wersji
Added alerts for long or short trend changeInformacje o Wersji
Add MTF support for slow EMAsInformacje o Wersji
SMA replaced by EMA for trend detectionInformacje o Wersji
Length of EMAs can be setInformacje o Wersji
MTF EMA not displayed by default, 20, 50, 200 ema default lengthInformacje o Wersji
ATR Stop added as dots (bullish, bearish)Informacje o Wersji
Input option for ema fast and middle lengthInformacje o Wersji
EMA Ribbon added with option to hide itInformacje o Wersji
Alert when price is close to trend EMA (default 200 EMA)Informacje o Wersji
Performance improved, ema ribbon removedInformacje o Wersji
TEMA for trend includedInformacje o Wersji
TEMA with custom length, pine version 5Informacje o Wersji
Refactoring and 4th ema addedInformacje o Wersji
ATR stoploss multiplier addedInformacje o Wersji
Added real price display for Heikin Ashi chart typeInformacje o Wersji
Labels for engulfing candles addedInformacje o Wersji
Engulfing pattern bug fixedInformacje o Wersji
Barcolor for engulfing addedInformacje o Wersji
Engulging candles added and atr to 10Informacje o Wersji
Volatility Stop Length addedInformacje o Wersji
Inside bar added as candlestick patternInformacje o Wersji
Inside bar without colorSkrypt chroniony
Ten skrypt został opublikowany jako zamknięty kod źródłowy. Można z tego korzystać swobodnie i bez żadnych ograniczeń — więcej informacji znajduje się tutaj.
Access our indicators from: indivisionx.com
Wyłączenie odpowiedzialności
Informacje i publikacje nie stanowią i nie powinny być traktowane jako porady finansowe, inwestycyjne, tradingowe ani jakiekolwiek inne rekomendacje dostarczane lub zatwierdzone przez TradingView. Więcej informacji znajduje się w Warunkach użytkowania.
Skrypt chroniony
Ten skrypt został opublikowany jako zamknięty kod źródłowy. Można z tego korzystać swobodnie i bez żadnych ograniczeń — więcej informacji znajduje się tutaj.
Access our indicators from: indivisionx.com
Wyłączenie odpowiedzialności
Informacje i publikacje nie stanowią i nie powinny być traktowane jako porady finansowe, inwestycyjne, tradingowe ani jakiekolwiek inne rekomendacje dostarczane lub zatwierdzone przez TradingView. Więcej informacji znajduje się w Warunkach użytkowania.