OPEN-SOURCE SCRIPT
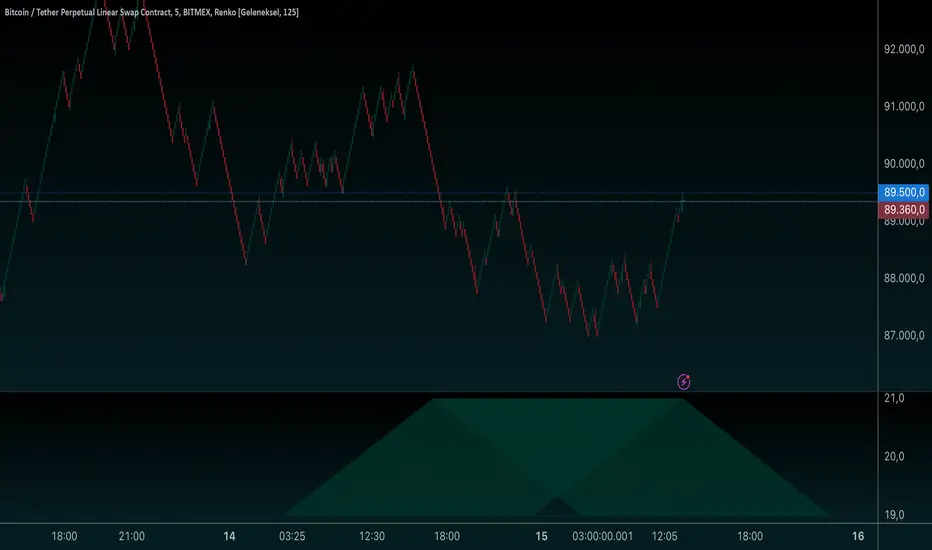
Platonic Solids Visualization-Scret Geometry-AYNET

Explanation:
Input Options:
solid: Choose the type of Platonic Solid (Tetrahedron, Cube, Octahedron, etc.).
size: Adjust the size of the geometry.
color_lines: Choose the color for the edges.
line_width: Set the width of the edges.
Geometry Calculations:
Each solid is drawn based on predefined coordinates and connected using the line.new function.
Geometric Types Supported:
Tetrahedron: A triangular pyramid.
Cube: A square-based 2D projection.
Octahedron: Two pyramids joined at the base.
Unsupported Solids:
Dodecahedron and Icosahedron are geometrically more complex and not rendered in this basic implementation.
Visualization:
The chosen Platonic Solid will be drawn relative to the center position (center_y) on the chart.
Adjust the size and center_y inputs to position the shape correctly.
Let me know if you need improvements or have a specific geometry to implement!
Skrypt open-source
W zgodzie z duchem TradingView twórca tego skryptu udostępnił go jako open-source, aby użytkownicy mogli przejrzeć i zweryfikować jego działanie. Ukłony dla autora. Korzystanie jest bezpłatne, jednak ponowna publikacja kodu podlega naszym Zasadom serwisu.
Wyłączenie odpowiedzialności
Informacje i publikacje nie stanowią i nie powinny być traktowane jako porady finansowe, inwestycyjne, tradingowe ani jakiekolwiek inne rekomendacje dostarczane lub zatwierdzone przez TradingView. Więcej informacji znajduje się w Warunkach użytkowania.