OPEN-SOURCE SCRIPT
Zaktualizowano Optimized WPR Strategy with Filters (Debug)
Identifying Market Trends:
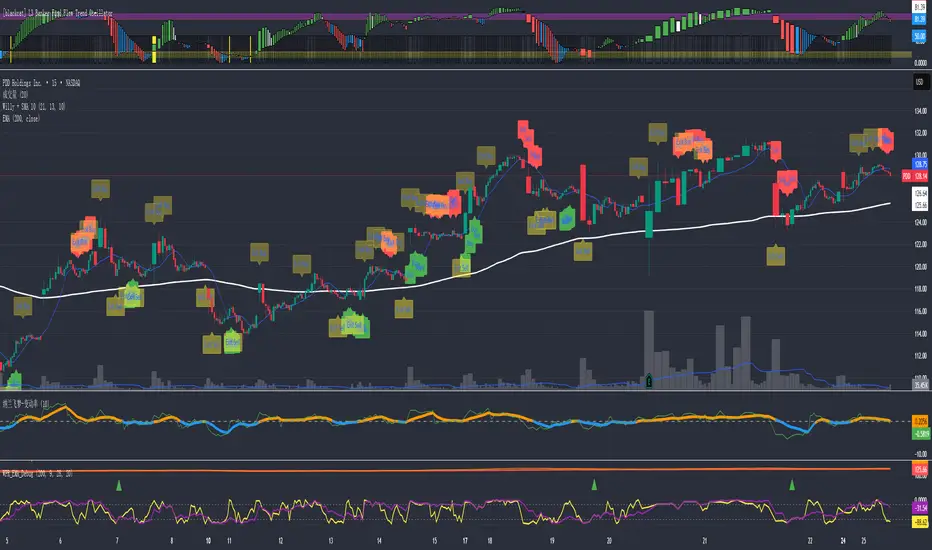
The 200-period EMA is used to determine the short-term trend of the market.
When the price is above the 200-period EMA, it suggests a potential bullish market and an uptrend, and the strategy will only look for buying opportunities.
When the price is below the 200-period EMA, it suggests a potential bearish market and a downtrend, and the strategy will only look for selling opportunities.
When the 200-period EMA intersects with the price, it indicates that the market may be in a directionless consolidation phase.
Identifying Potential Reversal Points:
The strategy employs two Williams %R (WPR) indicators: one with a 9-period (fast WPR) and another with a 28-period (slow WPR).
WPR is a momentum indicator used to identify overbought and oversold conditions in the market. Its value oscillates between -100 and 0, with values near -100 indicating oversold conditions and values near 0 indicating overbought conditions.
In an uptrend (when the price is above the 200 EMA), the strategy seeks buying opportunities when both WPR indicators cross above -80 (the oversold zone) from below. This is considered a bullish signal, suggesting the market may be about to rebound. Sell signals are ignored at this time.
In a downtrend (when the price is below the 200 EMA), the strategy seeks selling opportunities when both WPR indicators cross below -20 (the overbought zone) from above. This is considered a bearish signal, suggesting the market may be about to reverse downward. Buy signals are ignored at this time.
Summary:
In summary, this strategy first uses the 200-period EMA to determine the overall trend direction of the market. Then, within the confirmed trend direction, it utilizes the simultaneous crossing of the overbought or oversold zones by the dual WPR indicators to identify potential reversal points as entry signals for trading. The strategy emphasizes that trading signals are only valid when both WPR indicators meet the conditions.
Informacje o Wersji
dentifying Market Trends:The 200-period EMA is used to determine the short-term trend of the market.
When the price is above the 200-period EMA, it suggests a potential bullish market and an uptrend, and the strategy will only look for buying opportunities.
When the price is below the 200-period EMA, it suggests a potential bearish market and a downtrend, and the strategy will only look for selling opportunities.
When the 200-period EMA intersects with the price, it indicates that the market may be in a directionless consolidation phase.
Identifying Potential Reversal Points:
The strategy employs two Williams %R (WPR) indicators: one with a 9-period (fast WPR) and another with a 28-period (slow WPR).
WPR is a momentum indicator used to identify overbought and oversold conditions in the market. Its value oscillates between -100 and 0, with values near -100 indicating oversold conditions and values near 0 indicating overbought conditions.
In an uptrend (when the price is above the 200 EMA), the strategy seeks buying opportunities when both WPR indicators cross above -80 (the oversold zone) from below. This is considered a bullish signal, suggesting the market may be about to rebound. Sell signals are ignored at this time.
In a downtrend (when the price is below the 200 EMA), the strategy seeks selling opportunities when both WPR indicators cross below -20 (the overbought zone) from above. This is considered a bearish signal, suggesting the market may be about to reverse downward. Buy signals are ignored at this time.
Summary:
In summary, this strategy first uses the 200-period EMA to determine the overall trend direction of the market. Then, within the confirmed trend direction, it utilizes the simultaneous crossing of the overbought or oversold zones by the dual WPR indicators to identify potential reversal points as entry signals for trading. The strategy emphasizes that trading signals are only valid when both WPR indicators meet the conditions.
Skrypt open-source
W zgodzie z duchem TradingView twórca tego skryptu udostępnił go jako open-source, aby użytkownicy mogli przejrzeć i zweryfikować jego działanie. Ukłony dla autora. Korzystanie jest bezpłatne, jednak ponowna publikacja kodu podlega naszym Zasadom serwisu.
Wyłączenie odpowiedzialności
Informacje i publikacje nie stanowią i nie powinny być traktowane jako porady finansowe, inwestycyjne, tradingowe ani jakiekolwiek inne rekomendacje dostarczane lub zatwierdzone przez TradingView. Więcej informacji znajduje się w Warunkach użytkowania.