OPEN-SOURCE SCRIPT
Zaktualizowano MTF Phoenix Table
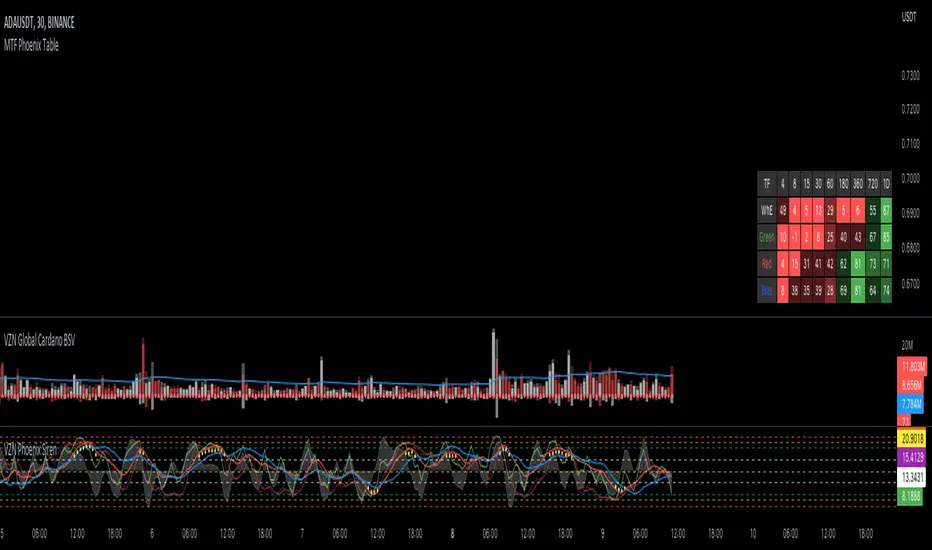
This is a MTF heatmap companion for the Phoenix Ascending indicator by WyckoffMode. It aims to make MTF analysis easier at a quick glance.
The row headings are color coordinated for easy visual recognition.
The row headings are color coordinated for easy visual recognition.
Informacje o Wersji
I have updated the table so that if a Phoenix Indicator Value in any time frame is currently trending down (relative to the previous bar) the text color in that cell will be fuchsia. Also I made a slight adjustment to two transparency levels for < 50 to help distinguish between them.
Informacje o Wersji
I reverted the text color change because it seems to have a bug. When the current chart timeframe is higher than the minimum timeframe in the table it doesn't always correctly call if the cell value is rising or falling.Informacje o Wersji
I was able to discover a fix so the table updated correctly and color the text correctly based on if the current cell value was less than the previous value. The text color that represents a descending value is yellow.Informacje o Wersji
Cell text color error removedInformacje o Wersji
As requested by some, I have adjusted the code so that the timeframes in the settings are adjustable and effect the TF header accordingly. All values under the daily will be expressed in minutes, e.g. 12H = 720.Skrypt open-source
W zgodzie z duchem TradingView twórca tego skryptu udostępnił go jako open-source, aby użytkownicy mogli przejrzeć i zweryfikować jego działanie. Ukłony dla autora. Korzystanie jest bezpłatne, jednak ponowna publikacja kodu podlega naszym Zasadom serwisu.
Wyłączenie odpowiedzialności
Informacje i publikacje nie stanowią i nie powinny być traktowane jako porady finansowe, inwestycyjne, tradingowe ani jakiekolwiek inne rekomendacje dostarczane lub zatwierdzone przez TradingView. Więcej informacji znajduje się w Warunkach użytkowania.
Skrypt open-source
W zgodzie z duchem TradingView twórca tego skryptu udostępnił go jako open-source, aby użytkownicy mogli przejrzeć i zweryfikować jego działanie. Ukłony dla autora. Korzystanie jest bezpłatne, jednak ponowna publikacja kodu podlega naszym Zasadom serwisu.
Wyłączenie odpowiedzialności
Informacje i publikacje nie stanowią i nie powinny być traktowane jako porady finansowe, inwestycyjne, tradingowe ani jakiekolwiek inne rekomendacje dostarczane lub zatwierdzone przez TradingView. Więcej informacji znajduje się w Warunkach użytkowania.