OPEN-SOURCE SCRIPT
UO_30-50-70
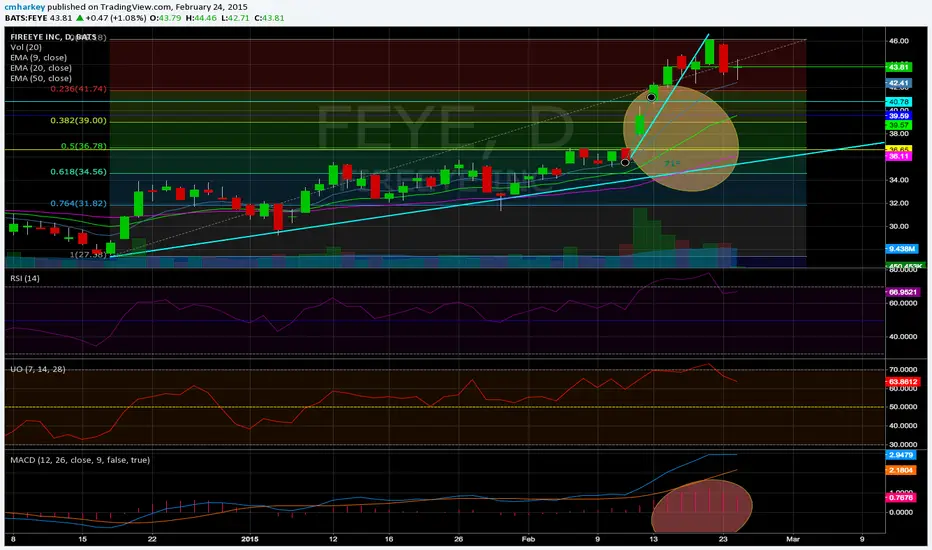
Ultimate Oscillator with bands present at the 30, 50, and 70 pt levels.
Personally use this every time, created a script to hard code these lines so I wouldn't need to redraw them all the time.
Enjoy
Personally use this every time, created a script to hard code these lines so I wouldn't need to redraw them all the time.
Enjoy
Skrypt open-source
W zgodzie z duchem TradingView twórca tego skryptu udostępnił go jako open-source, aby użytkownicy mogli przejrzeć i zweryfikować jego działanie. Ukłony dla autora. Korzystanie jest bezpłatne, jednak ponowna publikacja kodu podlega naszym Zasadom serwisu.
Wyłączenie odpowiedzialności
Informacje i publikacje nie stanowią i nie powinny być traktowane jako porady finansowe, inwestycyjne, tradingowe ani jakiekolwiek inne rekomendacje dostarczane lub zatwierdzone przez TradingView. Więcej informacji znajduje się w Warunkach użytkowania.