OPEN-SOURCE SCRIPT
oi + funding oscillator cryptosmart
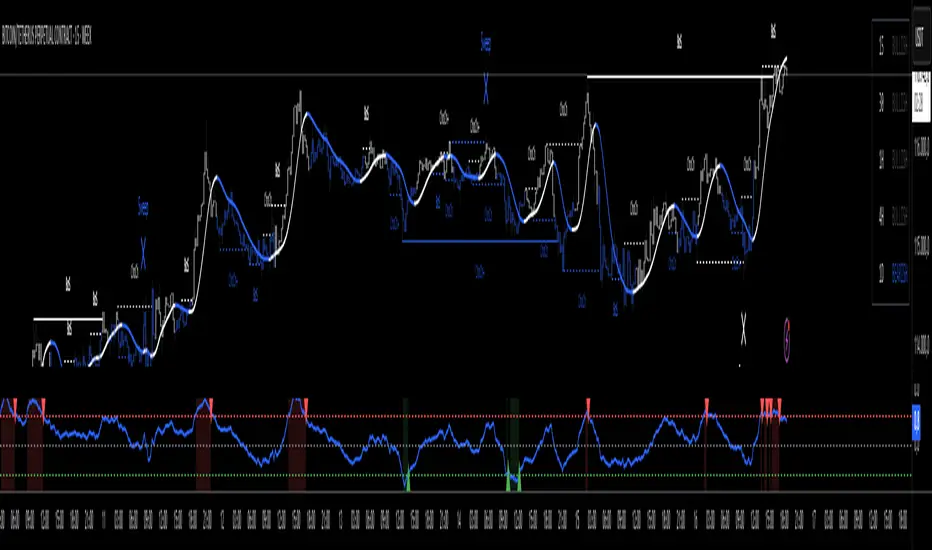
The oi + funding oscillator cryptosmart is an advanced momentum tool designed to gauge sentiment in the crypto derivatives market. It combines Open Interest (OI) changes with Funding Rates, normalizes them into a single oscillator using a z-score, and identifies potential market extremes.
This provides traders with a powerful visual guide to spot when the market is over-leveraged (overheated) or when a significant deleveraging event has occurred (oversold), signaling potential reversals.
How It Works
Combined Data: The indicator tracks the rate of change in Open Interest and the value of Funding Rates.
Oscillator: It blends these two data points into a single, smoothed oscillator line that moves above and below a zero line.
Extreme Zones:
Overheated (Red Zone): When the oscillator enters the upper critical zone, it suggests excessive greed and high leverage, increasing the risk of a sharp correction (long squeeze). A cross below this level generates a potential sell signal.
Oversold (Green Zone): When the oscillator enters the lower critical zone, it indicates panic, liquidations, and a potential market bottom. A cross above this level generates a potential buy signal.
Trading Strategy & Timeframes
This oscillator is designed to be versatile, but its effectiveness can vary depending on the timeframe.
Optimal Timeframes (1H and 4H): The indicator has shown its highest effectiveness on the 1-hour and 4-hour charts. These timeframes are ideal for capturing significant shifts in market sentiment reflected in OI and funding data, filtering out short-term noise while still providing timely reversal signals.
Lower Timeframes (e.g., 1-min, 5-min, 15-min): On shorter timeframes, the oscillator is still a highly effective tool, but it is best used as a confluence factor within a broader trading system. Due to the increased noise on these charts, it is not recommended to use its signals in isolation. Instead, use it as a final argument for entry. For example, if your primary scalping strategy gives you a buy signal, you can check if the oscillator is also exiting the oversold (green) zone to add a powerful layer of confirmation to your trade.
Skrypt open-source
W zgodzie z duchem TradingView twórca tego skryptu udostępnił go jako open-source, aby użytkownicy mogli przejrzeć i zweryfikować jego działanie. Ukłony dla autora. Korzystanie jest bezpłatne, jednak ponowna publikacja kodu podlega naszym Zasadom serwisu.
Wyłączenie odpowiedzialności
Informacje i publikacje nie stanowią i nie powinny być traktowane jako porady finansowe, inwestycyjne, tradingowe ani jakiekolwiek inne rekomendacje dostarczane lub zatwierdzone przez TradingView. Więcej informacji znajduje się w Warunkach użytkowania.