OPEN-SOURCE SCRIPT
Custom Support & Resistance Levels (Manual Input)
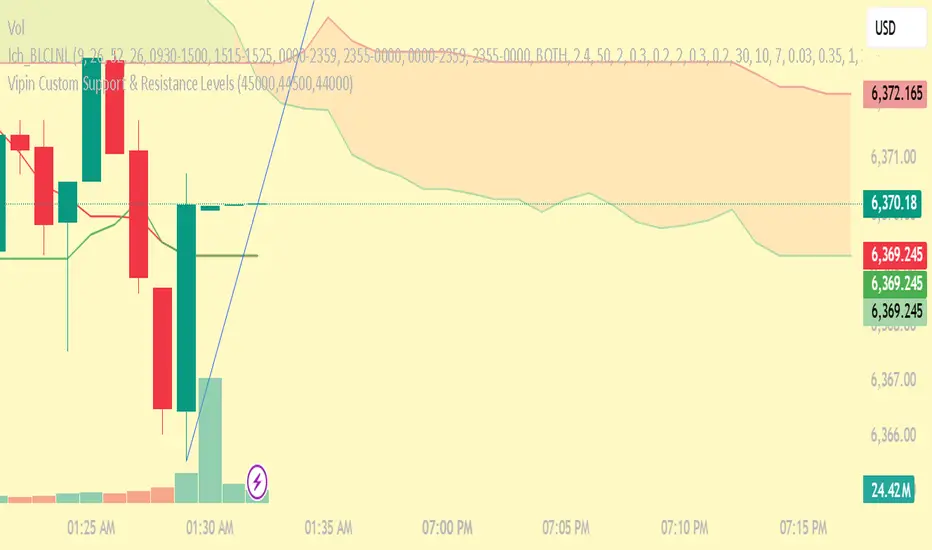
This indicator lets you plot your own support levels (and can be extended for resistance) directly on the chart by entering them as comma-separated values.
📌 Supports manual input for multiple price levels.
📊 Lines are extended across the chart for clear visualization.
🎨 Dynamic coloring:
Green if the current price is above the level.
Red if the current price is below the level.
🧹 Old lines are automatically cleared to avoid clutter.
This tool is ideal if you:
Prefer to mark your own key zones instead of relying only on auto-detected levels.
Want clean and simple visualization of critical price areas.
👉 Coming soon: Resistance levels input (commented in the code, can be enabled).
Skrypt open-source
W zgodzie z duchem TradingView twórca tego skryptu udostępnił go jako open-source, aby użytkownicy mogli przejrzeć i zweryfikować jego działanie. Ukłony dla autora. Korzystanie jest bezpłatne, jednak ponowna publikacja kodu podlega naszym Zasadom serwisu.
Wyłączenie odpowiedzialności
Informacje i publikacje nie stanowią i nie powinny być traktowane jako porady finansowe, inwestycyjne, tradingowe ani jakiekolwiek inne rekomendacje dostarczane lub zatwierdzone przez TradingView. Więcej informacji znajduje się w Warunkach użytkowania.