OPEN-SOURCE SCRIPT
Multi Timeframe Moving Average Convergence Divergence {DCAquant}
Overview
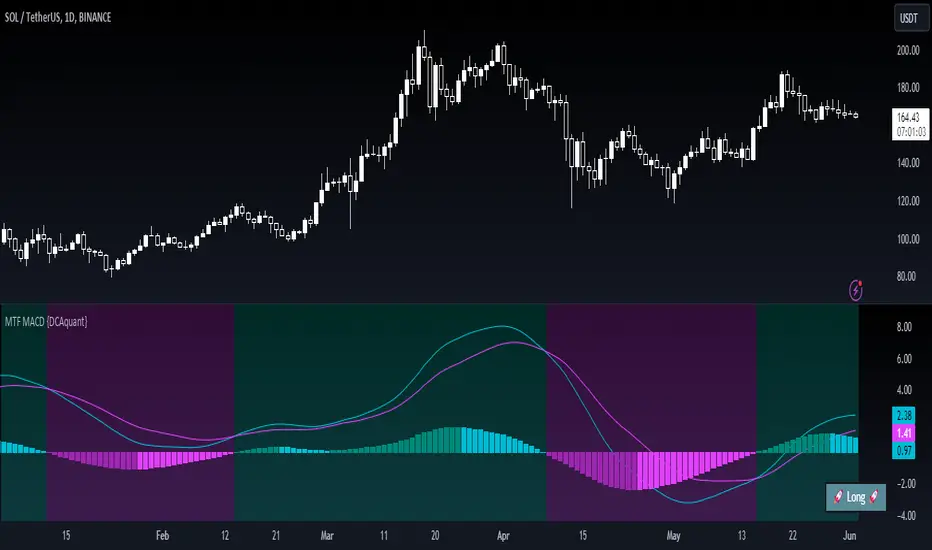
The MTF MACD indicator provides a unique view of MACD (Moving Average Convergence Divergence) and Signal Line dynamics across various timeframes. It calculates the MACD and Signal Line for each selected timeframe and aggregates them for analysis.
Key Features
MACD Calculation
Utilizes standard MACD calculations based on user-defined parameters like fast length, slow length, and signal smoothing.
Determines the difference between the MACD and Signal Line to identify convergence or divergence.
Multiple Timeframe Analysis
Allows users to select up to six different timeframes for analysis, ranging from minutes to days, providing a holistic view of market trends.
Calculates MACD and Signal Line for each timeframe independently.
Aggregated Analysis
Combines MACD and Signal Line values from multiple timeframes to derive a consolidated view.
Optionally applies moving average smoothing to aggregated MACD and Signal Line values for better clarity.
Position Identification
Determines the trading position (Long, Short, or Neutral) based on the relationship between MACD and Signal Line.
Considers the proximity of MACD and Signal Line to identify potential trading opportunities.
Visual Representation
Plots MACD and Signal Line on the price chart for visual analysis.
Utilizes color-coded backgrounds to indicate trading conditions (Long, Short, or Neutral) for quick interpretation.
Dynamic Table Display
Displays trading position alongside graphical indicators (rocket for Long, snowflake for Short, and star for Neutral) in a customizable table.
Offers flexibility in table placement and size for user preference.
How to Use
Parameter Configuration
Adjust parameters like fast length, slow length, and signal smoothing to fine-tune MACD calculations.
Select desired timeframes for analysis based on trading preferences and market conditions.
Interpretation
Monitor the relationship between MACD and Signal Line on the price chart.
Pay attention to color-coded backgrounds and graphical indicators in the table for actionable insights.
Decision Making
Consider entering Long positions when MACD is above the Signal Line and vice versa for Short positions.
Exercise caution during Neutral conditions, as there may be uncertainty in market direction.
Risk Management
Combine MTF MACD analysis with risk management strategies to optimize trade entries and exits.
Set stop-loss and take-profit levels based on individual risk tolerance and market conditions.
Conclusion
The Multi Timeframe Moving Average Convergence Divergence (MTF MACD) indicator offers a robust framework for traders to analyze market trends across multiple timeframes efficiently. By combining MACD insights from various time horizons and presenting them in a clear and actionable format, it empowers traders to make informed decisions and enhance their trading strategies.
Disclaimer
The Multi Timeframe Moving Average Convergence Divergence (MTF MACD) indicator provided here is intended for educational and informational purposes only. Trading in financial markets involves risk, and past performance is not indicative of future results. The use of this indicator does not guarantee profits or prevent losses.
Please be aware that trading decisions should be made based on your own analysis, risk tolerance, and financial situation. It is essential to conduct thorough research and seek advice from qualified financial professionals before engaging in any trading activity.
The MTF MACD indicator is a tool designed to assist traders in analyzing market trends and identifying potential trading opportunities. However, it is not a substitute for sound judgment and prudent risk management.
By using this indicator, you acknowledge that you are solely responsible for your trading decisions, and you agree to indemnify and hold harmless the developer and distributor of this indicator from any losses, damages, or liabilities arising from its use.
Trading in financial markets carries inherent risks, and you should only trade with capital that you can afford to lose. Exercise caution and discretion when implementing trading strategies, and consider seeking independent financial advice if necessary.
Skrypt open-source
W zgodzie z duchem TradingView twórca tego skryptu udostępnił go jako open-source, aby użytkownicy mogli przejrzeć i zweryfikować jego działanie. Ukłony dla autora. Korzystanie jest bezpłatne, jednak ponowna publikacja kodu podlega naszym Zasadom serwisu.
Wyłączenie odpowiedzialności
Informacje i publikacje nie stanowią i nie powinny być traktowane jako porady finansowe, inwestycyjne, tradingowe ani jakiekolwiek inne rekomendacje dostarczane lub zatwierdzone przez TradingView. Więcej informacji znajduje się w Warunkach użytkowania.