OPEN-SOURCE SCRIPT
Midnight and 7:30 AM Open with Reset
Extreme Discount and Extreme Premium Indicator
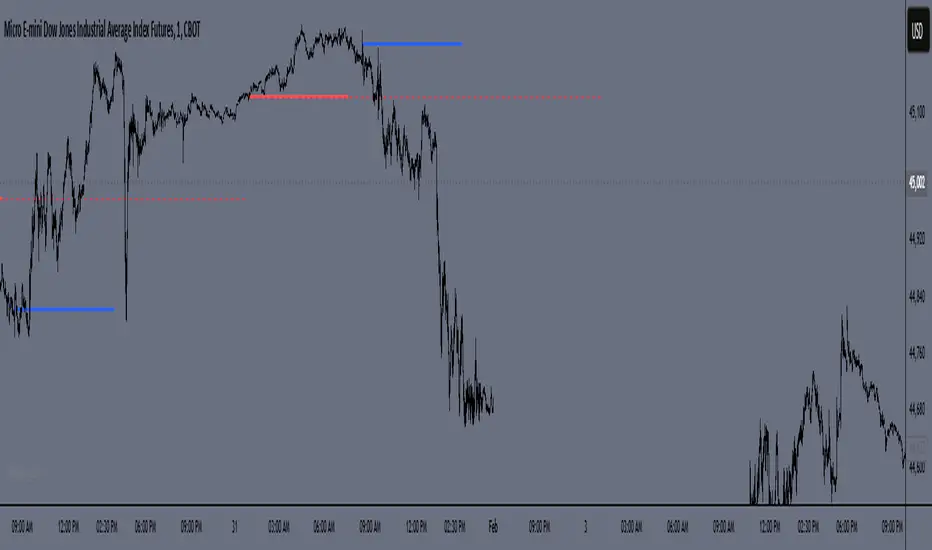
This custom indicator identifies the relationship between the current price and key discount and premium levels on the chart. It helps determine whether the price is in an "extreme discount" or "extreme premium" zone, which can be important for making trading decisions based on market structure.
Extreme Discount Zone: The indicator identifies the "extreme discount" zone when the price is below both its extreme discount levels, indicating that the market is in a potential buying area, which could signal a reversal or a good entry point to buy.
Extreme Premium Zone: The indicator marks the "extreme premium" zone when the price is above both its extreme premium levels, suggesting that the market is in a potential selling area, signaling a possible price reversal or a good entry point to sell.
The indicator dynamically adjusts and highlights these zones based on price movement, allowing traders to visualize when the price is reaching extreme levels relative to historical price action.
Key Features:
Detects when the current price is below both extreme discount levels.
Detects when the current price is above both extreme premium levels.
Highlights these extreme areas visually to help traders make informed decisions on buying or selling.
Skrypt open-source
W zgodzie z duchem TradingView twórca tego skryptu udostępnił go jako open-source, aby użytkownicy mogli przejrzeć i zweryfikować jego działanie. Ukłony dla autora. Korzystanie jest bezpłatne, jednak ponowna publikacja kodu podlega naszym Zasadom serwisu.
Wyłączenie odpowiedzialności
Informacje i publikacje nie stanowią i nie powinny być traktowane jako porady finansowe, inwestycyjne, tradingowe ani jakiekolwiek inne rekomendacje dostarczane lub zatwierdzone przez TradingView. Więcej informacji znajduje się w Warunkach użytkowania.