PROTECTED SOURCE SCRIPT
VWAP Mean Reversion Zones
Description:
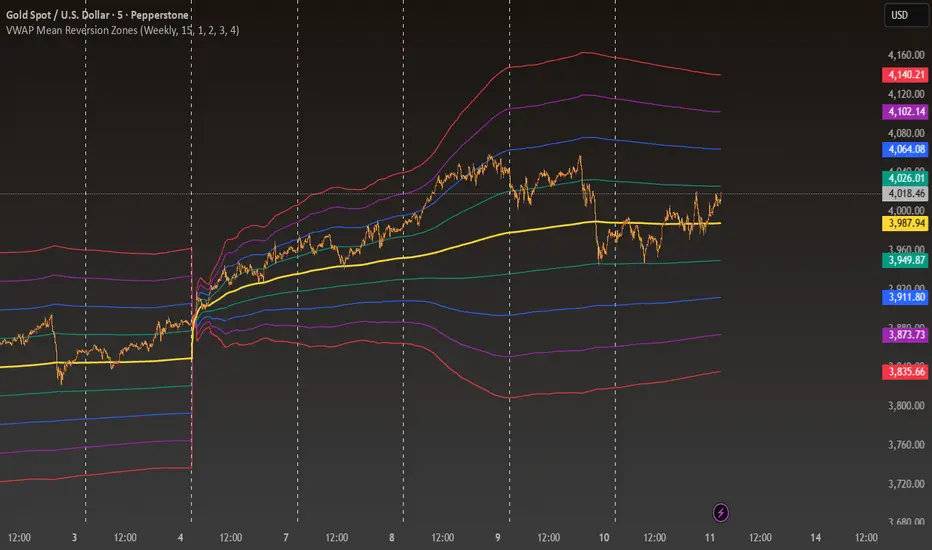
VWAP Mean Reversion Zones is a multi-timeframe VWAP indicator designed to reveal price deviations and volatility structure across higher-timeframe anchors. It calculates a Volume-Weighted Average Price (VWAP) from a user-selectable timeframe (Daily, Weekly, or Monthly) and overlays it directly on your chart.
The script also computes multiple standard deviation bands around the smoothed VWAP, allowing traders to identify areas of potential mean reversion, trend extension, and volatility compression. Each deviation band helps distinguish the relative distance of price from the VWAP centerline.
Key Features:
Selectable VWAP anchor period: Daily, Weekly, or Monthly.
Multi-timeframe VWAP calculation using volume and price weighting.
Four customizable standard deviation bands with independent multipliers.
Distinct colors and full opacity for clear visual separation.
Smoothed VWAP centerline for reduced noise and better trend visualization.
Use Cases:
Identify overbought or oversold conditions relative to VWAP.
Detect volatility expansion and contraction zones.
Align entries and exits with higher-timeframe VWAP structure.
Combine with price action or other indicators for confluence trading.
This indicator is ideal for traders who rely on VWAP dynamics and mean-reversion principles to guide entries, exits, and risk management.
Skrypt chroniony
Ten skrypt został opublikowany jako zamknięty kod źródłowy. Możesz jednak używać go swobodnie i bez żadnych ograniczeń – więcej informacji tutaj.
Wyłączenie odpowiedzialności
Informacje i publikacje przygotowane przez TradingView lub jego użytkowników, prezentowane na tej stronie, nie stanowią rekomendacji ani porad handlowych, inwestycyjnych i finansowych i nie powinny być w ten sposób traktowane ani wykorzystywane. Więcej informacji na ten temat znajdziesz w naszym Regulaminie.