OPEN-SOURCE SCRIPT
Saturn Retrograde Periods
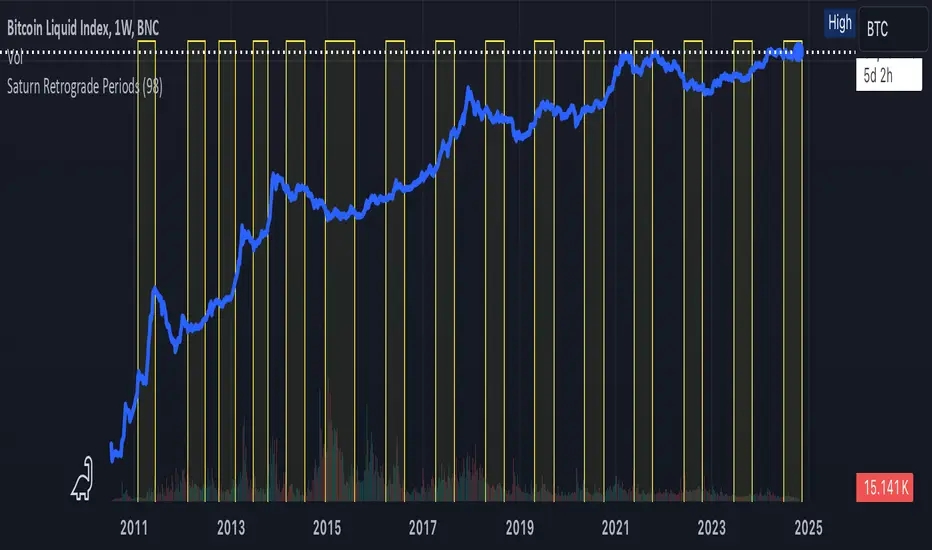
Saturn Retrograde Periods Visualizer for TradingView
This Pine Script visualizes all Saturn retrograde periods since 2009, including the current retrograde ending on November 15, 2024. The script overlays yellow boxes on your TradingView chart to highlight the exact periods of Saturn retrograde. It's a great tool for astrologically-inclined traders or those interested in market timing based on astrological events.
Key Features:
Full Historical Coverage: Displays Saturn retrograde periods from 2009 (the inception of Bitcoin) to the current retrograde ending in November 2024.
Customizable Appearance: You can easily adjust the color and opacity of the boxes directly from the script's settings window, making it flexible for various chart styles.
Visual Clarity: The boxes span the full vertical range of your chart, ensuring the retrograde periods are clearly visible over any asset, timeframe, or price action.
How to Use:
Add the script to your TradingView chart.
Adjust the color and opacity in the settings to suit your preferences.
View all relevant Saturn retrograde periods and analyze how these astrological events may align with price movements in your selected asset.
This script is perfect for traders and analysts who want to combine astrology with financial market analysis!
scripted by chat.gpt - version 1.0
Skrypt open-source
W zgodzie z duchem TradingView twórca tego skryptu udostępnił go jako open-source, aby użytkownicy mogli przejrzeć i zweryfikować jego działanie. Ukłony dla autora. Korzystanie jest bezpłatne, jednak ponowna publikacja kodu podlega naszym Zasadom serwisu.
Wyłączenie odpowiedzialności
Informacje i publikacje nie stanowią i nie powinny być traktowane jako porady finansowe, inwestycyjne, tradingowe ani jakiekolwiek inne rekomendacje dostarczane lub zatwierdzone przez TradingView. Więcej informacji znajduje się w Warunkach użytkowania.