Moving Average Shift [ChartPrime]Moving Average Shift indicator combines multiple moving average (MA) types with a unique MA Shift Oscillator to help traders visualize trend direction, price deviations, and mean reversion states.
⯁ KEY FEATURES
Customizable Moving Averages: Choose from SMA, EMA, SMMA (RMA), WMA, or VWMA.
Trend-Based Coloring: Candles are dynamically colored based on price position relative to the MA.
MA Shift Oscillator: Identifies price deviations and potential mean reversion zones.
Threshold Filtering: Helps filter mean reversion signals using a user-defined threshold.
Diamond Signals for Mean Reversion: Plots diamonds on the chart when the oscillator crosses back above or below the threshold level.
Oscillator Color Coding: The oscillator has four color states:
Color 1: Above 0 and increasing.
Color 2: Above 0 and decreasing.
Color 3: Below 0 and increasing.
Color 4: Below 0 and decreasing.
⯁ HOW TO USE
Use the indicator to follow the trend based on MA direction and price relation to it.
The MA Shift Oscillator helps identify potential mean reversion points where price may revert toward the MA.
The threshold setting allows traders to filter out weak mean reversion signals and focus on significant shifts.
The four-color oscillator visually indicates trend momentum and potential trend shifts.
⯁ CONCLUSION
The Moving Average Shift indicator is a powerful tool that merges trend-following and mean reversion strategies into one comprehensive system. By allowing traders to select different types of moving averages, it provides flexibility in trend analysis while visually enhancing price action with dynamic candle coloring. The MA Shift Oscillator further strengthens decision-making by detecting deviations and highlighting potential mean reversion points.
Wskaźniki i strategie

HTF Trend Tracker [BigBeluga]HTF Trend Tracker is a higher timeframe (HTF) trend tracking indicator designed to help traders identify significant trends, key levels, and market sentiment. The indicator dynamically adapts to the current price action, using HTF highs and lows to display trend direction and strength with detailed visuals.
🔵 Key Features:
Dynamic Trend Detection:
Uptrend is identified when the price closes above the HTF high.
Downtrend is detected when the price closes below the HTF low.
Midline changes color dynamically based on the trend direction:
Bullish Green: Indicates an uptrend.
Bearish Red: Indicates a downtrend.
Historical and Active HTF Levels:
Historic HTF highs and lows are displayed as dotted lines.
Current active HTF high and low levels are shown as solid lines.
Timeframe labels (e.g., "1D High" or "1D Low") mark the active levels for clarity.
Trend Change Signals:
A green checkmark (✓) is plotted when an uptrend starts.
A red cross (✕) appears when a downtrend begins.
Trend-Based Candle Coloring:
Candle colors change dynamically based on the trend and the price's distance from the midline:
Intense Bullish Green: Price is far above the midline during an uptrend.
Intense Bearish Red: Price is far below the midline during a downtrend.
Neutral Gray: Price is near the midline.
Users can customize the colors to suit their preferences.
🔵 Usage:
Identify uptrends and downtrends using the midline's color and the position of the close relative to the HTF levels.
Use solid lines and timeframe labels to track current HTF high and low levels.
Observe dotted lines for historical HTF levels to understand past price behavior.
Watch for checkmark (✓) and cross (✕) signals to spot trend changes and key market shifts.
Monitor candle colors to gauge trend intensity and proximity to the midline:
Intense colors signal strong trends, while neutral gray indicates consolidation near the midline.
HTF Trend Tracker is an essential tool for traders aiming to follow higher timeframe trends, identify key levels, and make data-driven decisions based on price dynamics and trend strength. Its customizable features allow for flexible integration into any trading strategy.

Air Gap MTFThis scripts automatically locate the EMA values on 30min/1hr/4hr for user specified EMA values.
On chart it will draw a line for each of the EMA, also labelling which MTF and timeframe, along with the current price.
The lines and price tag will update automatically in real-time so you don't have to keep adjusting the line!

Key Levels by MoneyTribe21This script provides dynamic tracking of the following:
ATH - tracks the all time high price
PDH - tracks the previous day high price
PDL - tracks the previous day low price
RESISTANCE - based on the current day high
SUPPORT - based on the current day low
DAILY OPEN - tracks the market open price at the start of the day
This script is provided by www.moneytribe21.com
all rights reserved © Justin Harrison

Taka Swing Super Moving AveragesEste es un indicador de super trend que se utiliza para hacer entradas según la tendencia del mercado. Y cuando de la señal de ventas y compras usamos un stop loss según el indicador nos recomiende.

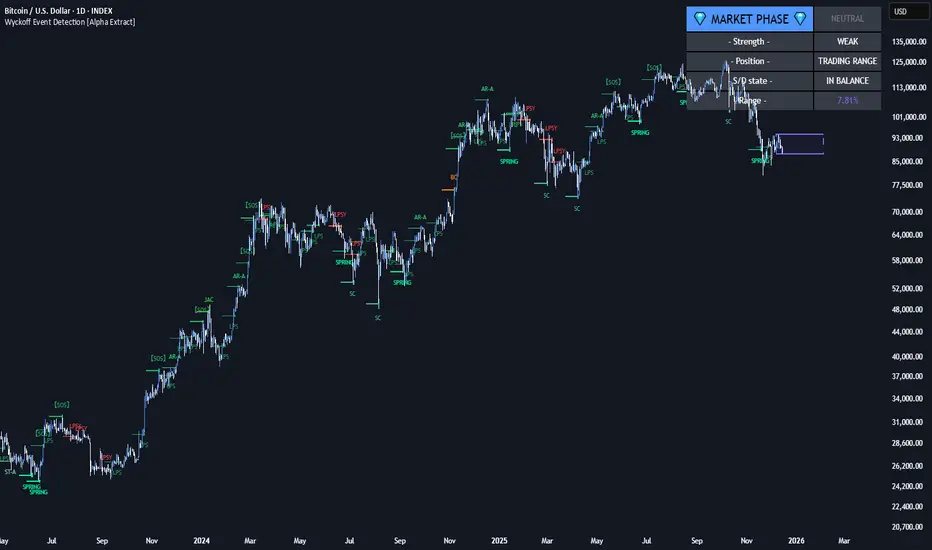
Wyckoff Event Detection [Alpha Extract]Wyckoff Event Detection
A powerful and intelligent indicator designed to detect key Wyckoff events in real time, helping traders analyze market structure and anticipate potential trend shifts. Using volume and price action, this script automatically identifies distribution and accumulation phases, providing traders with valuable insights into market behavior.
🔶 Phase-Based Detection
Utilizes a phase detection algorithm that evaluates price and volume conditions to identify accumulation (bullish) and distribution (bearish) events. This method ensures the script effectively captures major market turning points and avoids noise.
🔶 Multi-Factor Event Recognition
Incorporates multiple event conditions, including upthrusts, selling climaxes, and springs, to detect high-probability entry and exit points. Each event is filtered through customizable sensitivity settings, ensuring precise detection aligned with different trading styles.
🔶 Customizable Parameters
Fine-tune event detection with adjustable thresholds for volume, price movement, trend strength, and event spacing. These inputs allow traders to personalize the script to match their strategy and risk tolerance.
// === USER INPUTS ===
i_volLen = input.int(20, "Volume MA Length", minval=1)
i_priceLookback = input.int(20, "Price Pattern Lookback", minval=5)
i_lineLength = input.int(15, "Line Length", minval=5)
i_labelSpacing = input.int(5, "Minimum Label Spacing (bars)", minval=1, maxval=20)
❓How It Works
🔶 Event Identification
The script scans for key Wyckoff events by analyzing volume spikes, price deviations, and trend shifts within a user-defined lookback period. It categorizes events into bullish (accumulation) or bearish (distribution) structures and plots them directly on the chart.
// === EVENT DETECTION ===
volMA = ta.sma(volume, i_volLen)
highestHigh = ta.highest(high, i_priceLookback)
lowestLow = ta.lowest(low, i_priceLookback)
🔶 Automatic Filtering & Cleanup
Unconfirmed or weak signals are filtered out using customizable strength multipliers and volume thresholds. Events that do not meet the minimum conditions are discarded to keep the chart clean and informative.
🔶 Phase Strength Analysis
The script continuously tracks bullish and bearish event counts to determine whether the market is currently in an accumulation, distribution, or neutral phase. This allows traders to align their strategies accordingly.
🔶 Visual Alerts & Labels
Detects and labels key Wyckoff events directly on the chart, providing immediate insights into market conditions:
- PSY (Preliminary Supply) and UT (Upthrust) for distribution phases.
- PS (Preliminary Support) and SC (Selling Climax) for accumulation phases.
- Labels adjust dynamically to avoid chart clutter and improve readability.
🔶 Entry & Exit Optimization
By highlighting supply and demand imbalances, the script assists traders in identifying optimal entry and exit points. Wyckoff concepts such as springs and upthrusts provide clear trade signals based on market structure.
🔶 Trend Confirmation & Risk Management
Observing how price reacts to detected events helps confirm trend direction and potential reversals. Traders can place stop-loss and take-profit levels based on Wyckoff phase analysis, ensuring strategic trade execution.
🔶 Table-Based Market Analysis (Table)
A built-in table summarizes:
- Market Phase: Accumulation, Distribution, or Neutral.
- Strength of Phase: Weak, Moderate, or Strong.
- Price Positioning: Whether price is near support, resistance, or in a trading range.
- Supply/Demand State: Identifies whether the market is supply or demand dominant.
🔶 Why Choose Wyckoff Market Phases - Alpha Extract?
This indicator offers a systematic approach to understanding market mechanics through the lens of Wyckoff's time-tested principles. By providing clear and actionable insights into market phases, it empowers traders to make informed decisions, enhancing both confidence and performance in various trading environments.
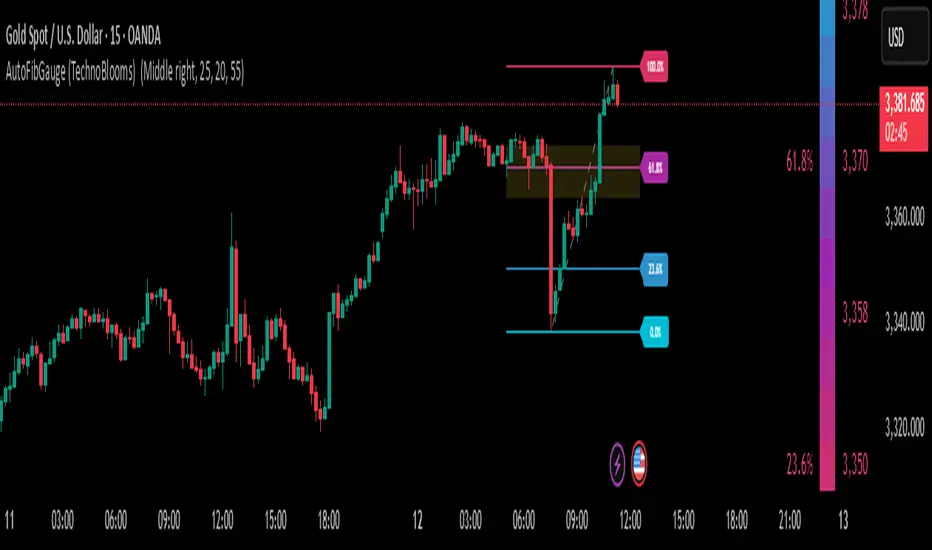
AutoFibGauge (TechnoBlooms) AutoFibGauge help users to understand Fibonacci retracement with auto-drawn levels from previous candes, dual moving average crossover for trend confirmation, and a thermometer for quick Fib level identification.
This indicator is designed to streamline your trading decisions. By automatically plotting the Fibonacci levels based on previous candles, it aids in identifying key support and resistance zones. User can choose the number of previous candles for which the Fibonacci is calculated.
Paired with a dual moving average crossover system for robust trend confirmation, this tools helps in aligning with the market's direction.
A dynamic thermometer display that instantly highlights critical Fib levels, making it easier than ever to spot opportunities at a glance.
Harsha All IndicatorsHarsha All-In-One Indicator – 17 Indicator Signal Table
This All-In-One Indicator combines 17 powerful indicators into a single tabular display, providing clear Buy/Sell/Neutral signals for better decision-making. It is designed for traders who want a quick and efficient way to analyze multiple technical indicators in one place.
📌 Key Features:
✅ 17 Technical Indicators in One Table – Includes Supertrend, MACD, RSI, ADX, Stochastic, VWAP, Bollinger Bands, and more!
✅ Customizable Parameters – Easily adjust settings for each indicator to suit your strategy.
✅ Clear Buy/Sell Signals – The table uses green (Buy), red (Sell), and gray (Neutral) color codes for easy interpretation.
✅ No Chart Clutter – Instead of plotting multiple indicators, all signals are neatly displayed in a table.
✅ Works on All Timeframes – Suitable for scalping, intraday, and swing trading.
🛠️ Included Indicators:
1️⃣ Supertrend – Trend-following indicator for buy/sell signals
2️⃣ ADX (Average Directional Index) – Measures trend strength
3️⃣ HMA (Hull Moving Average) – Smooth moving average crossover signals
4️⃣ MACD (Moving Average Convergence Divergence) – Momentum-based trend analysis
5️⃣ RSI (Relative Strength Index) – Identifies overbought/oversold conditions
6️⃣ Divergence Detector – Highlights trend reversal signals
7️⃣ No Trade Zone (ADX Filter) – Filters weak market conditions
8️⃣ EMA (Exponential Moving Average) – 50-period trend crossover
9️⃣ WMA (Weighted Moving Average) – Smoothed price trend detection
🔟 SMA (Simple Moving Average) – Classic 50-period moving average crossover
1️⃣1️⃣ Bollinger Bands – Identifies volatility breakout opportunities
1️⃣2️⃣ HarPAI – Custom proprietary trend-following indicator
1️⃣3️⃣ VWAP (Volume Weighted Average Price) – Institutional price levels
1️⃣4️⃣ ATR (Average True Range) – Measures volatility levels
1️⃣5️⃣ Stochastic Oscillator – Confirms overbought/oversold conditions
1️⃣6️⃣ HARMACD (Hybrid RSI + MACD) – Combines RSI & Stochastic for refined signals
1️⃣7️⃣ TMMS-MACD (Custom MACD & Stochastic Filter) – Enhances MACD signals for stronger confirmations
🔧 Customizat Harsha All-In-One Indicator – 17 Indicator Signal Table
This All-In-One Indicator combines 17 powerful indicators into a single tabular display, providing clear Buy/Sell/Neutral signals for better decision-making. It is designed for traders who want a quick and efficient way to analyze multiple technical indicators in one place.
📌 Key Features:
✅ 17 Technical Indicators in One Table – Includes Supertrend, MACD, RSI, ADX, Stochastic, VWAP, Bollinger Bands, and more!
✅ Customizable Parameters – Easily adjust settings for each indicator to suit your strategy.
✅ Clear Buy/Sell Signals – The table uses green (Buy), red (Sell), and gray (Neutral) color codes for easy interpretation.
✅ No Chart Clutter – Instead of plotting multiple indicators, all signals are neatly displayed in a table.
✅ Works on All Timeframes – Suitable for scalping, intraday, and swing trading.
🛠️ Included Indicators:
1️⃣ Supertrend – Trend-following indicator for buy/sell signals
2️⃣ ADX (Average Directional Index) – Measures trend strength
3️⃣ HMA (Hull Moving Average) – Smooth moving average crossover signals
4️⃣ MACD (Moving Average Convergence Divergence) – Momentum-based trend analysis
5️⃣ RSI (Relative Strength Index) – Identifies overbought/oversold conditions
6️⃣ Divergence Detector – Highlights trend reversal signals
7️⃣ No Trade Zone (ADX Filter) – Filters weak market conditions
8️⃣ EMA (Exponential Moving Average) – 50-period trend crossover
9️⃣ WMA (Weighted Moving Average) – Smoothed price trend detection
🔟 SMA (Simple Moving Average) – Classic 50-period moving average crossover
1️⃣1️⃣ Bollinger Bands – Identifies volatility breakout opportunities
1️⃣2️⃣ HarPAI – Custom proprietary trend-following indicator
1️⃣3️⃣ VWAP (Volume Weighted Average Price) – Institutional price levels
1️⃣4️⃣ ATR (Average True Range) – Measures volatility levels
1️⃣5️⃣ Stochastic Oscillator – Confirms overbought/oversold conditions
1️⃣6️⃣ HARMACD (Hybrid RSI + MACD) – Combines RSI & Stochastic for refined signals
1️⃣7️⃣ TMMS-MACD (Custom MACD & Stochastic Filter) – Enhances MACD signals for stronger confirmations
🔧 Customization & Settings:
Each indicator comes with adjustable settings, allowing traders to fine-tune their strategy based on market conditions. Users can modify:
✅ MACD Lengths & Signal Smoothing
✅ RSI Overbought/Oversold Levels
✅ Supertrend Multiplier & ATR Period
✅ Moving Average Periods
✅ Bollinger Bands Standard Deviations
✅ ADX Sensitivity
... and more!
📈 How to Use:
1️⃣ Add the indicator to your TradingView chart.
2️⃣ Customize the settings in the input panel as per your strategy.
3️⃣ Refer to the table for real-time Buy (🟢), Sell (🔴), or Neutral (⚫) signals.
4️⃣ Use this tool for trend confirmation, entry/exit signals, and market condition analysis.
📢 Disclaimer:
This indicator is for educational purposes only. Trading involves risk, and past performance does not guarantee future results. Always backtest and use proper risk management.
🚀 Optimize your trades with the power of 17 indicators in one table! 🚀ion & Settings:
Each indicator comes with adjustable settings, allowing traders to fine-tune their strategy based on market conditions. Users can modify:
✅ MACD Lengths & Signal Smoothing
✅ RSI Overbought/Oversold Levels
✅ Supertrend Multiplier & ATR Period
✅ Moving Average Periods
✅ Bollinger Bands Standard Deviations
✅ ADX Sensitivity
... and more!
📈 How to Use:
1️⃣ Add the indicator to your TradingView chart.
2️⃣ Customize the settings in the input panel as per your strategy.
3️⃣ Refer to the table for real-time Buy (🟢), Sell (🔴), or Neutral (⚫) signals.
4️⃣ Use this tool for trend confirmation, entry/exit signals, and market condition analysis.
📢 Disclaimer:
This indicator is for educational purposes only. Trading involves risk, and past performance does not guarantee future results. Always backtest and use proper risk management.
🚀 Optimize your trades with the power of 17 indicators in one table! 🚀

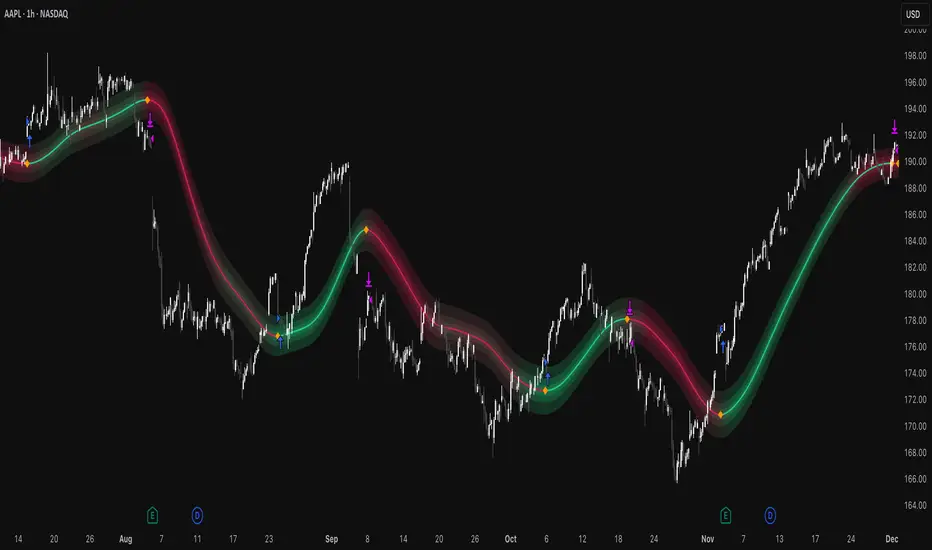
Gradient Trend Filter STRATEGY [ChartPrime/PineIndicators]This strategy is based on the Gradient Trend Filter indicator developed by ChartPrime. Full credit for the concept and indicator goes to ChartPrime.
The Gradient Trend Filter Strategy is designed to execute trades based on the trend analysis and filtering system provided by the Gradient Trend Filter indicator. It integrates a noise-filtered trend detection system with a color-gradient visualization, helping traders identify trend strength, momentum shifts, and potential reversals.
How the Gradient Trend Filter Strategy Works
1. Noise Filtering for Smoother Trends
To reduce false signals caused by market noise, the strategy applies a three-stage smoothing function to the source price. This function ensures that trend shifts are detected more accurately, minimizing unnecessary trade entries and exits.
The filter is based on an Exponential Moving Average (EMA)-style smoothing technique.
It processes price data in three successive passes, refining the trend signal before generating trade entries.
This filtering technique helps eliminate minor fluctuations and highlights the true underlying trend.
2. Multi-Layered Trend Bands & Color-Based Trend Visualization
The Gradient Trend Filter constructs multiple trend bands around the filtered trend line, acting as dynamic support and resistance zones.
The mid-line changes color based on the trend direction:
Green for uptrends
Red for downtrends
A gradient cloud is formed around the trend line, dynamically shifting colors to provide early warning signals of trend reversals.
The outer bands function as potential support and resistance, helping traders determine stop-loss and take-profit zones.
Visualization elements used in this strategy:
Trend Filter Line → Changes color between green (bullish) and red (bearish).
Trend Cloud → Dynamically adjusts color based on trend strength.
Orange Markers → Appear when a trend shift is confirmed.
Trade Entry & Exit Conditions
This strategy automatically enters trades based on confirmed trend shifts detected by the Gradient Trend Filter.
1. Trade Entry Rules
Long Entry:
A bullish trend shift is detected (trend direction changes to green).
The filtered trend value crosses above zero, confirming upward momentum.
The strategy enters a long position.
Short Entry:
A bearish trend shift is detected (trend direction changes to red).
The filtered trend value crosses below zero, confirming downward momentum.
The strategy enters a short position.
2. Trade Exit Rules
Closing a Long Position:
If a bearish trend shift occurs, the strategy closes the long position.
Closing a Short Position:
If a bullish trend shift occurs, the strategy closes the short position.
The trend shift markers (orange diamonds) act as a confirmation signal, reinforcing the validity of trade entries and exits.
Customization Options
This strategy allows traders to adjust key parameters for flexibility in different market conditions:
Trade Direction: Choose between Long Only, Short Only, or Long & Short .
Trend Length: Modify the length of the smoothing function to adapt to different timeframes.
Line Width & Colors: Customize the visual appearance of trend lines and cloud colors.
Performance Table: Enable or disable the equity performance table that tracks historical trade results.
Performance Tracking & Reporting
A built-in performance table is included to monitor monthly and yearly trading performance.
The table calculates monthly percentage returns, displaying them in a structured format.
Color-coded values highlight profitable months (blue) and losing months (red).
Tracks yearly cumulative performance to assess long-term strategy effectiveness.
Traders can use this feature to evaluate historical performance trends and optimize their strategy settings accordingly.
How to Use This Strategy
Identify Trend Strength & Reversals:
Use the trend line and cloud color changes to assess trend strength and detect potential reversals.
Monitor Momentum Shifts:
Pay attention to gradient cloud color shifts, as they often appear before the trend line changes color.
This can indicate early momentum weakening or strengthening.
Act on Trend Shift Markers:
Use orange diamonds as confirmation signals for trend shifts and trade entry/exit points.
Utilize Cloud Bands as Support/Resistance:
The outer bands of the cloud serve as dynamic support and resistance, helping with stop-loss and take-profit placement.
Considerations & Limitations
Trend Lag: Since the strategy applies a smoothing function, entries may be slightly delayed compared to raw price action.
Volatile Market Conditions: In high-volatility markets, trend shifts may occur more frequently, leading to higher trade frequency.
Optimized for Trend Trading: This strategy is best suited for trending markets and may produce false signals in sideways (ranging) conditions.
Conclusion
The Gradient Trend Filter Strategy is a trend-following system based on the Gradient Trend Filter indicator by ChartPrime. It integrates noise filtering, trend visualization, and gradient-based color shifts to help traders identify strong market trends and potential reversals.
By combining trend filtering with a multi-layered cloud system, the strategy provides clear trade signals while minimizing noise. Traders can use this strategy for long-term trend trading, momentum shifts, and support/resistance-based decision-making.
This strategy is a fully automated system that allows traders to execute long, short, or both directions, with customizable settings to adapt to different market conditions.
Credit for the original concept and indicator goes to ChartPrime.
ZigZag++ZigZag NY Session: Precisión y Personalización para tu Análisis Técnico 📈✨
🚀 ZigZag NY Session es una versión mejorada del clásico indicador ZigZag, diseñada para traders que buscan una visión más clara y estructurada de los cambios de tendencia.
🔹 Características destacadas:
✅ Configuración avanzada de profundidad, desviación y retroceso.
✅ Dibujo dinámico de líneas ZigZag con etiquetas personalizadas para identificar máximos y mínimos.
✅ Sesiones de mercado personalizables: Define la hora y los minutos exactos de tu sesión de análisis.
✅ Sombra de sesión configurable para destacar períodos clave en el gráfico.
✅ Colores y transparencias ajustables para una mejor visualización.
✅ Alertas automáticas para cambios de dirección y nuevos puntos clave (HH, LL, LH, HL).
🔥 Ideal para traders de todos los niveles que buscan mejorar su precisión en la identificación de tendencias y estructuras del mercado.
📌 Añádelo a tu gráfico y optimiza tu estrategia ahora mismo! 💡🚀
Si quieres que agregue algo más, dime y lo ajustamos. ¡Éxito con tu publicación! 🎯💪

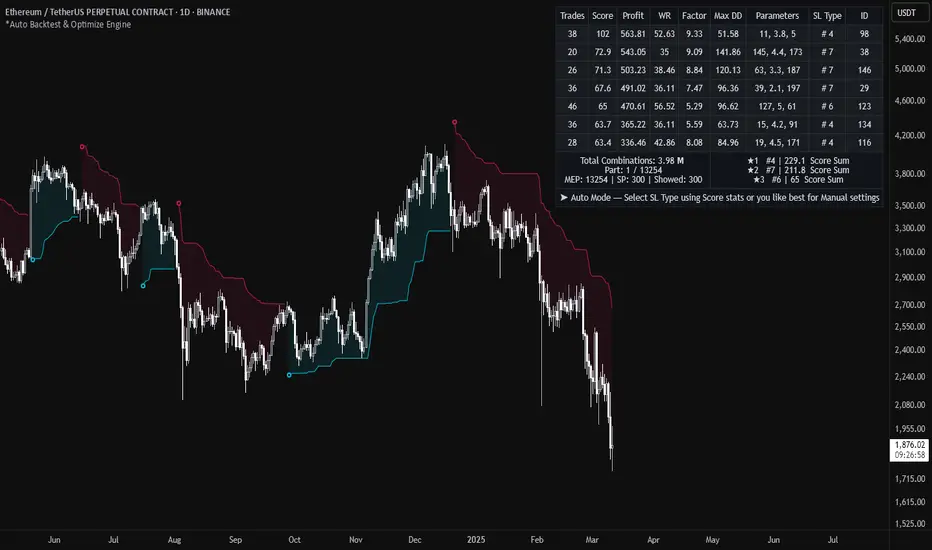
*Auto Backtest & Optimize EngineFull-featured Engine for Automatic Backtesting and parameter optimization. Allows you to test millions of different combinations of stop-loss and take profit parameters, including on any connected indicators.
⭕️ Key Futures
Quickly identify the optimal parameters for your strategy.
Automatically generate and test thousands of parameter combinations.
A simple Genetic Algorithm for result selection.
Saves time on manual testing of multiple parameters.
Detailed analysis, sorting, filtering and statistics of results.
Detailed control panel with many tooltips.
Display of key metrics: Profit, Win Rate, etc..
Comprehensive Strategy Score calculation.
In-depth analysis of the performance of different types of stop-losses.
Possibility to use to calculate the best Stop-Take parameters for your position.
Ability to test your own functions and signals.
Customizable visualization of results.
Flexible Stop-Loss Settings:
• Auto ━ Allows you to test all types of Stop Losses at once(listed below).
• S.VOLATY ━ Static stop based on volatility (Fixed, ATR, STDEV).
• Trailing ━ Classic trailing stop following the price.
• Fast Trail ━ Accelerated trailing stop that reacts faster to price movements.
• Volatility ━ Dynamic stop based on volatility indicators.
• Chandelier ━ Stop based on price extremes.
• Activator ━ Dynamic stop based on SAR.
• MA ━ Stop based on moving averages (9 different types).
• SAR ━ Parabolic SAR (Stop and Reverse).
Advanced Take-Profit Options:
• R:R: Risk/Reward ━ sets TP based on SL size.
• T.VOLATY ━ Calculation based on volatility indicators (Fixed, ATR, STDEV).
Testing Modes:
• Stops ━ Cyclical stop-loss testing
• Pivot Point Example ━ Example of using pivot points
• External Example ━ Built-in example how test functions with different parameters
• External Signal ━ Using external signals
⭕️ Usage
━ First Steps:
When opening, select any point on the chart. It will not affect anything until you turn on Manual Start mode (more on this below).
The chart will immediately show the best results of the default Auto mode. You can switch Part's to try to find even better results in the table.
Now you can display any result from the table on the chart by entering its ID in the settings.
Repeat steps 3-4 until you determine which type of Stop Loss you like best. Then set it in the settings instead of Auto mode.
* Example: I flipped through 14 parts before I liked the first result and entered its ID so I could visually evaluate it on the chart.
Then select the stop loss type, choose it in place of Auto mode and repeat steps 3-4 or immediately follow the recommendations of the algorithm.
Now the Genetic Algorithm at the bottom right will prompt you to enter the Parameters you need to search for and select even better results.
Parameters must be entered All at once before they are updated. Enter recommendations strictly in fields with the same names.
Repeat steps 5-6 until there are approximately 10 Part's left or as you like. And after that, easily pour through the remaining Parts and select the best parameters.
━ Example of the finished result.
━ Example of use with Takes
You can also test at the same time along with Take Profit. In this example, I simply enabled Risk/Reward mode and immediately specified in the TP field Maximum RR, Minimum RR and Step. So in this example I can test (3-1) / 0.1 = 20 Takes of different sizes. There are additional tips in the settings.
━
* Soon you will start to understand how the system works and things will become much easier.
* If something doesn't work, just reset the engine settings and start over again.
* Use the tips I have left in the settings and on the Panel.
━ Details:
Sort ━ Sorting results by Score, Profit, Trades, etc..
Filter ━ Filtring results by Score, Profit, Trades, etc..
Trade Type ━ Ability to disable Long\Short but only from statistics.
BackWin ━ Backtest Window Number of Candle the script can test.
Manual Start ━ Enabling it will allow you to call a Stop from a selected point. which you selected when you started the engine.
* If you have a real open position then this mode can help to save good Stop\Take for it.
1 - 9 Сheckboxs ━ Allow you to disable any stop from Auto mode.
Ex Source - Allow you to test Stops/Takes from connected indicators.
Connection guide:
//@version=6
indicator("My script")
rsi = ta.rsi(close, 14)
buy = not na(rsi) and ta.crossover (rsi, 40) // OS = 40
sell = not na(rsi) and ta.crossunder(rsi, 60) // OB = 60
Signal = buy ? +1 : sell ? -1 : 0
plot(Signal, "🔌Connector🔌", display = display.none)
* Format the signal for your indicator in a similar style and then select it in Ex Source.
⭕️ How it Works
Hypothesis of Uniform Distribution of Rare Elements After Mixing.
'This hypothesis states that if an array of N elements contains K valid elements, then after mixing, these valid elements will be approximately uniformly distributed.'
'This means that in a random sample of k elements, the proportion of valid elements should closely match their proportion in the original array, with some random variation.'
'According to the central limit theorem, repeated sampling will result in an average count of valid elements following a normal distribution.'
'This supports the assumption that the valid elements are evenly spread across the array.'
'To test this hypothesis, we can conduct an experiment:'
'Create an array of 1,000,000 elements.'
'Select 1,000 random elements (1%) for validation.'
'Shuffle the array and divide it into groups of 1,000 elements.'
'If the hypothesis holds, each group should contain, on average, 1~ valid element, with minor variations.'
* I'd like to attach more details to My hypothesis but it won't be very relevant here. Since this is a whole separate topic, I will leave the minimum part for understanding the engine.
Practical Application
To apply this hypothesis, I needed a way to generate and thoroughly mix numerous possible combinations. Within Pine, generating over 100,000 combinations presents significant challenges, and storing millions of combinations requires excessive resources.
I developed an efficient mechanism that generates combinations in random order to address these limitations. While conventional methods often produce duplicates or require generating a complete list first, my approach guarantees that the first 10% of possible combinations are both unique and well-distributed. Based on my hypothesis, this sampling is sufficient to determine optimal testing parameters.
Most generators and randomizers fail to accommodate both my hypothesis and Pine's constraints. My solution utilizes a simple Linear Congruential Generator (LCG) for pseudo-randomization, enhanced with prime numbers to increase entropy during generation. I pre-generate the entire parameter range and then apply systematic mixing. This approach, combined with a hybrid combinatorial array-filling technique with linear distribution, delivers excellent generation quality.
My engine can efficiently generate and verify 300 unique combinations per batch. Based on the above, to determine optimal values, only 10-20 Parts need to be manually scrolled through to find the appropriate value or range, eliminating the need for exhaustive testing of millions of parameter combinations.
For the Score statistic I applied all the same, generated a range of Weights, distributed them randomly for each type of statistic to avoid manual distribution.
Score ━ based on Trade, Profit, WinRate, Profit Factor, Drawdown, Sharpe & Sortino & Omega & Calmar Ratio.
⭕️ Notes
For attentive users, a little tricks :)
To save time, switch parts every 3 seconds without waiting for it to load. After 10-20 parts, stop and wait for loading. If the pause is correct, you can switch between the rest of the parts without loading, as they will be cached. This used to work without having to wait for a pause, but now it does slower. This will save a lot of time if you are going to do a deeper backtest.
Sometimes you'll get the error “The scripts take too long to execute.”
For a quick fix you just need to switch the TF or Ticker back and forth and most likely everything will load.
The error appears because of problems on the side of the site because the engine is very heavy. It can also appear if you set too long a period for testing in BackWin or use a heavy indicator for testing.
Manual Start - Allow you to Start you Result from any point. Which in turn can help you choose a good stop-stick for your real position.
* It took me half a year from idea to current realization. This seems to be one of the few ways to build something automatic in backtest format and in this particular Pine environment. There are already better projects in other languages, and they are created much easier and faster because there are no limitations except for personal PC. If you see solutions to improve this system I would be glad if you share the code. At the moment I am tired and will continue him not soon.
Also You can use my previosly big Backtest project with more manual settings(updated soon)
Moving Averages By MoneyTribe21This indicator provides 3 Smoothed Moving Averages;
* 21 Day
* 50 Day
* 200 Day
You can also adjust the visual settings to your preferences:
This script is provided by www,moneytribe21.com
all rights reserved © Justin Harrison

Awesome Oscillator (AO) with Signals [AIBitcoinTrend]👽 Multi-Scale Awesome Oscillator (AO) with Signals (AIBitcoinTrend)
The Multi-Scale Awesome Oscillator transforms the traditional Awesome Oscillator (AO) by integrating multi-scale wavelet filtering, enhancing its ability to detect momentum shifts while maintaining responsiveness across different market conditions.
Unlike conventional AO calculations, this advanced version refines trend structures using high-frequency, medium-frequency, and low-frequency wavelet components, providing traders with superior clarity and adaptability.
Additionally, it features real-time divergence detection and an ATR-based dynamic trailing stop, making it a powerful tool for momentum analysis, reversals, and breakout strategies.
👽 What Makes the Multi-Scale AO – Wavelet-Enhanced Momentum Unique?
Unlike traditional AO indicators, this enhanced version leverages wavelet-based decomposition and volatility-adjusted normalization, ensuring improved signal consistency across various timeframes and assets.
✅ Wavelet Smoothing – Multi-Scale Extraction – Captures short-term fluctuations while preserving broader trend structures.
✅ Frequency-Based Detail Weights – Separates high, medium, and low-frequency components to reduce noise and improve trend clarity.
✅ Real-Time Divergence Detection – Identifies bullish and bearish divergences for early trend reversals.
✅ Crossovers & ATR-Based Trailing Stops – Implements intelligent trade management with adaptive stop-loss levels.
👽 The Math Behind the Indicator
👾 Wavelet-Based AO Smoothing
The indicator applies multi-scale wavelet decomposition to extract high-frequency, medium-frequency, and low-frequency trend components, ensuring an optimal balance between reactivity and smoothness.
sma1 = ta.sma(signal, waveletPeriod1)
sma2 = ta.sma(signal, waveletPeriod2)
sma3 = ta.sma(signal, waveletPeriod3)
detail1 = signal - sma1 // High-frequency detail
detail2 = sma1 - sma2 // Intermediate detail
detail3 = sma2 - sma3 // Low-frequency detail
advancedAO = weightDetail1 * detail1 + weightDetail2 * detail2 + weightDetail3 * detail3
Why It Works:
Short-Term Smoothing: Captures rapid fluctuations while minimizing noise.
Medium-Term Smoothing: Balances short-term and long-term trends.
Long-Term Smoothing: Enhances trend stability and reduces false signals.
👾 Z-Score Normalization
To ensure consistency across different markets, the Awesome Oscillator is normalized using a Z-score transformation, making overbought and oversold levels stable across all assets.
normFactor = ta.stdev(advancedAO, normPeriod)
normalizedAO = advancedAO / nz(normFactor, 1)
Why It Works:
Standardizes AO values for comparison across assets.
Enhances signal reliability, preventing misleading spikes.
👽 How Traders Can Use This Indicator
👾 Divergence Trading Strategy
Bullish Divergence
Price makes a lower low, while AO forms a higher low.
A buy signal is confirmed when AO starts rising.
Bearish Divergence
Price makes a higher high, while AO forms a lower high.
A sell signal is confirmed when AO starts declining.
👾 Buy & Sell Signals with Trailing Stop
Bullish Setup:
✅AO crosses above the bullish trigger level → Buy Signal.
✅Trailing stop placed at Low - (ATR × Multiplier).
✅Exit if price crosses below the stop.
Bearish Setup:
✅AO crosses below the bearish trigger level → Sell Signal.
✅Trailing stop placed at High + (ATR × Multiplier).
✅Exit if price crosses above the stop.
👽 Why It’s Useful for Traders
Wavelet-Enhanced Filtering – Retains essential trend details while eliminating excessive noise.
Multi-Scale Momentum Analysis – Separates different trend frequencies for enhanced clarity.
Real-Time Divergence Alerts – Identifies early reversal signals for better entries and exits.
ATR-Based Risk Management – Ensures stops dynamically adapt to market conditions.
Works Across Markets & Timeframes – Suitable for stocks, forex, crypto, and futures trading.
👽 Indicator Settings
AO Short Period – Defines the short-term moving average for AO calculation.
AO Long Period – Defines the long-term moving average for AO smoothing.
Wavelet Smoothing – Adjusts multi-scale decomposition for different market conditions.
Divergence Detection – Enables or disables real-time divergence analysis. Normalization Period – Sets the lookback period for standard deviation-based AO normalization.
Cross Signals Sensitivity – Controls crossover signal strength for buy/sell signals.
ATR Trailing Stop Multiplier – Adjusts the sensitivity of the trailing stop.
Disclaimer: This indicator is designed for educational purposes and does not constitute financial advice. Please consult a qualified financial advisor before making investment decisions.

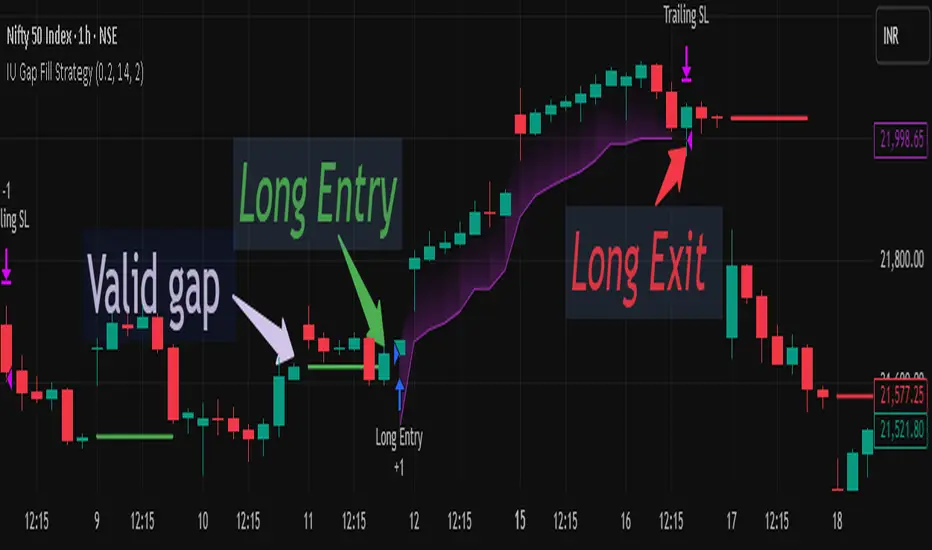
IU Gap Fill StrategyThe IU Gap Fill Strategy is designed to capitalize on price gaps that occur between trading sessions. It identifies gaps based on a user-defined percentage threshold and executes trades when the price fills the gap within a day. This strategy is ideal for traders looking to take advantage of market inefficiencies that arise due to overnight or session-based price movements. An ATR-based trailing stop-loss is incorporated to dynamically manage risk and lock in profits.
USER INPUTS
Percentage Difference for Valid Gap - Defines the minimum gap size in percentage terms for a valid trade setup. ( Default is 0.2 )
ATR Length - Sets the lookback period for the Average True Range (ATR) calculation. (default is 14 )
ATR Factor - Determines the multiplier for the trailing stop-loss, helping in risk management. ( Default is 2.00 )
LONG CONDITION
A gap-up occurs, meaning the current session opens above the previous session’s close.
The price initially dips below the previous session's close but then recovers and closes above it.
The gap meets the valid percentage threshold set by the user.
The bar is not the first or last bar of the session to avoid false signals.
SHORT CONDITION
A gap-down occurs, meaning the current session opens below the previous session’s close.
The price initially moves above the previous session’s close but then closes below it.
The gap meets the valid percentage threshold set by the user.
The bar is not the first or last bar of the session to avoid false signals.
LONG EXIT
An ATR-based trailing stop-loss is set below the entry price and dynamically adjusts upwards as the price moves in favor of the trade.
The position is closed when the trailing stop-loss is hit.
SHORT EXIT
An ATR-based trailing stop-loss is set above the entry price and dynamically adjusts downwards as the price moves in favor of the trade.
The position is closed when the trailing stop-loss is hit.
WHY IT IS UNIQUE
Precision in Identifying Gaps - The strategy focuses on real price gaps rather than minor fluctuations.
Dynamic Risk Management - Uses ATR-based trailing stop-loss to secure profits while allowing the trade to run.
Versatility - Works on stocks, indices, forex, and any market that experiences session-based gaps.
Optimized Entry Conditions - Ensures entries are taken only when the price attempts to fill the gap, reducing false signals.
HOW USERS CAN BENEFIT FROM IT
Enhance Trade Timing - Captures high-probability trade setups based on market inefficiencies caused by gaps.
Minimize Risk - The ATR trailing stop-loss helps protect gains and limit losses.
Works in Different Market Conditions - Whether markets are trending or consolidating, the strategy adapts to potential gap fill opportunities.
Fully Customizable - Users can fine-tune gap percentage, ATR settings, and stop-loss parameters to match their trading style.
AI Adaptive Oscillator [PhenLabs]📊 Algorithmic Adaptive Oscillator
Version: PineScript™ v6
📌 Description
The AI Adaptive Oscillator is a sophisticated technical indicator that employs ensemble learning and adaptive weighting techniques to analyze market conditions. This innovative oscillator combines multiple traditional technical indicators through an AI-driven approach that continuously evaluates and adjusts component weights based on historical performance. By integrating statistical modeling with machine learning principles, the indicator adapts to changing market dynamics, providing traders with a responsive and reliable tool for market analysis.
🚀 Points of Innovation:
Ensemble learning framework with adaptive component weighting
Performance-based scoring system using directional accuracy
Dynamic volatility-adjusted smoothing mechanism
Intelligent signal filtering with cooldown and magnitude requirements
Signal confidence levels based on multi-factor analysis
🔧 Core Components
Ensemble Framework : Combines up to five technical indicators with performance-weighted integration
Adaptive Weighting : Continuous performance evaluation with automated weight adjustment
Volatility-Based Smoothing : Adapts sensitivity based on current market volatility
Pattern Recognition : Identifies potential reversal patterns with signal qualification criteria
Dynamic Visualization : Professional color schemes with gradient intensity representation
Signal Confidence : Three-tiered confidence assessment for trading signals
🔥 Key Features
The indicator provides comprehensive market analysis through:
Multi-Component Ensemble : Integrates RSI, CCI, Stochastic, MACD, and Volume-weighted momentum
Performance Scoring : Evaluates each component based on directional prediction accuracy
Adaptive Smoothing : Automatically adjusts based on market volatility
Pattern Detection : Identifies potential reversal patterns in overbought/oversold conditions
Signal Filtering : Prevents excessive signals through cooldown periods and minimum change requirements
Confidence Assessment : Displays signal strength through intuitive confidence indicators (average, above average, excellent)
🎨 Visualization
Gradient-Filled Oscillator : Color intensity reflects strength of market movement
Clear Signal Markers : Distinct bullish and bearish pattern signals with confidence indicators
Range Visualization : Clean representation of oscillator values from -6 to 6
Zero Line : Clear demarcation between bullish and bearish territory
Customizable Colors : Color schemes that can be adjusted to match your chart style
Confidence Symbols : Intuitive display of signal confidence (no symbol, +, or ++) alongside direction markers
📖 Usage Guidelines
⚙️ Settings Guide
Color Settings
Bullish Color
Default: #2b62fa (Blue)
This setting controls the color representation for bullish movements in the oscillator. The color appears when the oscillator value is positive (above zero), with intensity indicating the strength of the bullish momentum. A brighter shade indicates stronger bullish pressure.
Bearish Color
Default: #ce9851 (Amber)
This setting determines the color representation for bearish movements in the oscillator. The color appears when the oscillator value is negative (below zero), with intensity reflecting the strength of the bearish momentum. A more saturated shade indicates stronger bearish pressure.
Signal Settings
Signal Cooldown (bars)
Default: 10
Range: 1-50
This parameter sets the minimum number of bars that must pass before a new signal of the same type can be generated. Higher values reduce signal frequency and help prevent overtrading during choppy market conditions. Lower values increase signal sensitivity but may generate more false positives.
Min Change For New Signal
Default: 1.5
Range: 0.5-3.0
This setting defines the minimum required change in oscillator value between consecutive signals of the same type. It ensures that new signals represent meaningful changes in market conditions rather than minor fluctuations. Higher values produce fewer but potentially higher-quality signals, while lower values increase signal frequency.
AI Core Settings
Base Length
Default: 14
Minimum: 2
This fundamental setting determines the primary calculation period for all technical components in the ensemble (RSI, CCI, Stochastic, etc.). It represents the lookback window for each component’s base calculation. Shorter periods create a more responsive but potentially noisier oscillator, while longer periods produce smoother signals with potential lag.
Adaptive Speed
Default: 0.1
Range: 0.01-0.3
Controls how quickly the oscillator adapts to new market conditions through its volatility-adjusted smoothing mechanism. Higher values make the oscillator more responsive to recent price action but potentially more erratic. Lower values create smoother transitions but may lag during rapid market changes. This parameter directly influences the indicator’s adaptiveness to market volatility.
Learning Lookback Period
Default: 150
Minimum: 10
Determines the historical data range used to evaluate each ensemble component’s performance and calculate adaptive weights. This setting controls how far back the AI “learns” from past performance to optimize current signals. Longer periods provide more stable weight distribution but may be slower to adapt to regime changes. Shorter periods adapt more quickly but may overreact to recent anomalies.
Ensemble Size
Default: 5
Range: 2-5
Specifies how many technical components to include in the ensemble calculation.
Understanding The Interaction Between Settings
Base Length and Learning Lookback : The base length determines the reactivity of individual components, while the lookback period determines how their weights are adjusted. These should be balanced according to your timeframe - shorter timeframes benefit from shorter base lengths, while the lookback should generally be 10-15 times the base length for optimal learning.
Adaptive Speed and Signal Cooldown : These settings control sensitivity from different angles. Increasing adaptive speed makes the oscillator more responsive, while reducing signal cooldown increases signal frequency. For conservative trading, keep adaptive speed low and cooldown high; for aggressive trading, do the opposite.
Ensemble Size and Min Change : Larger ensembles provide more stable signals, allowing for a lower minimum change threshold. Smaller ensembles might benefit from a higher threshold to filter out noise.
Understanding Signal Confidence Levels
The indicator provides three distinct confidence levels for both bullish and bearish signals:
Average Confidence (▲ or ▼) : Basic signal that meets the minimum pattern and filtering criteria. These signals indicate potential reversals but with moderate confidence in the prediction. Consider using these as initial alerts that may require additional confirmation.
Above Average Confidence (▲+ or ▼+) : Higher reliability signal with stronger underlying metrics. These signals demonstrate greater consensus among the ensemble components and/or stronger historical performance. They offer increased probability of successful reversals and can be traded with less additional confirmation.
Excellent Confidence (▲++ or ▼++) : Highest quality signals with exceptional underlying metrics. These signals show strong agreement across oscillator components, excellent historical performance, and optimal signal strength. These represent the indicator’s highest conviction trade opportunities and can be prioritized in your trading decisions.
Confidence assessment is calculated through a multi-factor analysis including:
Historical performance of ensemble components
Degree of agreement between different oscillator components
Relative strength of the signal compared to historical thresholds
✅ Best Use Cases:
Identify potential market reversals through oscillator extremes
Filter trade signals based on AI-evaluated component weights
Monitor changing market conditions through oscillator direction and intensity
Confirm trade signals from other indicators with adaptive ensemble validation
Detect early momentum shifts through pattern recognition
Prioritize trading opportunities based on signal confidence levels
Adjust position sizing according to signal confidence (larger for ++ signals, smaller for standard signals)
⚠️ Limitations
Requires sufficient historical data for accurate performance scoring
Ensemble weights may lag during dramatic market condition changes
Higher ensemble sizes require more computational resources
Performance evaluation quality depends on the learning lookback period length
Even high confidence signals should be considered within broader market context
💡 What Makes This Unique
Adaptive Intelligence : Continuously adjusts component weights based on actual performance
Ensemble Methodology : Combines strength of multiple indicators while minimizing individual weaknesses
Volatility-Adjusted Smoothing : Provides appropriate sensitivity across different market conditions
Performance-Based Learning : Utilizes historical accuracy to improve future predictions
Intelligent Signal Filtering : Reduces noise and false signals through sophisticated filtering criteria
Multi-Level Confidence Assessment : Delivers nuanced signal quality information for optimized trading decisions
🔬 How It Works
The indicator processes market data through five main components:
Ensemble Component Calculation :
Normalizes traditional indicators to consistent scale
Includes RSI, CCI, Stochastic, MACD, and volume components
Adapts based on the selected ensemble size
Performance Evaluation :
Analyzes directional accuracy of each component
Calculates continuous performance scores
Determines adaptive component weights
Oscillator Integration :
Combines weighted components into unified oscillator
Applies volatility-based adaptive smoothing
Scales final values to -6 to 6 range
Signal Generation :
Detects potential reversal patterns
Applies cooldown and magnitude filters
Generates clear visual markers for qualified signals
Confidence Assessment :
Evaluates component agreement, historical accuracy, and signal strength
Classifies signals into three confidence tiers (average, above average, excellent)
Displays intuitive confidence indicators (no symbol, +, ++) alongside direction markers
💡 Note:
The AI Adaptive Oscillator performs optimally when used with appropriate timeframe selection and complementary indicators. Its adaptive nature makes it particularly valuable during changing market conditions, where traditional fixed-weight indicators often lose effectiveness. The ensemble approach provides a more robust analysis by leveraging the collective intelligence of multiple technical methodologies. Pay special attention to the signal confidence indicators to optimize your trading decisions - excellent (++) signals often represent the most reliable trade opportunities.

Minervini-O'Neil Winner Patternthis is using a few indicators and some criterias. This is taken from oneail and minervenis ideas. Not sure if this is good or not just testing so done use it like a moron

MACD/RSI StrengthMACD/RSI Strength Indicator - A combination of the MACD and RSI indicators to show market strength and weakness.

RSI & MACD Combo IndicatorThe RSI & MACD Combo Indicator is designed to help traders identify high-probability trend reversal points by combining the Relative Strength Index (RSI) and the Moving Average Convergence Divergence (MACD).
How It Works:
Buy Signal 🟢:
RSI is below 35 (oversold condition).
MACD crosses above the signal line (bullish crossover).
Sell Signal 🔴:
RSI is above 65 (overbought condition).
MACD crosses below the signal line (bearish crossover).
Features:
✅ Customizable RSI & MACD settings.
✅ Background color highlights buy/sell zones.
✅ Alerts for buy and sell signals.
✅ ATR-based labels for trade entries.
This indicator helps traders confirm momentum shifts and avoid false breakouts by requiring confluence between momentum (RSI) and trend confirmation (MACD).

Breaker, Market Structure, ADR ZonesThis is hybrid of multiple scripts spliced together and consists of the following:
1. LuxAlgo's 2023 Breaker Blocks with Signals
2. LuxAlgo's 2023 Market Structure CHoCH/BOS (Fractal)
3. TFlab's 2024 Market Structures + ZigZag CHoCH/BOS - MSS/MSB
4. KivancOzbiligic's 2021 Supertrend
5. DreadBlitz's 2019 Bollinger Bands on MACD
6. LoneSomeTheBlue's 2021 Higher High Lower Low Strategy (With Source Code)
7. the author(s) of TradingView's in-house VWAP indicator
Special shoutout to the following indicators:
UAlgo's Price Action Volumetric Order Blocks
TTrades Daily Bias by TradeforOpp (based on the youtube video by TTrades
-----------------------------------------------------------------------------------------
The code produces Breaker Blocks (which are based on ICT concepts), shows Changes of Character "ChoCh" and Breaks of Structure "BOS", Higher Highs and Lower Lows, Volume Weighed Average Price (VWAP), and Average Daily Range (ADR) zones.
It also includes an indicator table to show confluence: whether price is currently above or below VWAP, whether the 13, 21, and 50 emas are ordered bearish or bullish, whether SuperTrend is in a bullish or bearish trend, and the current momentum and speed of the current candle via derivations from Commodity Channel Index (CCI). Finally, it also allows the user to the display Heiken Ashi candle shadows to see trend through the noise.
It is intended to be useful for both swing and day trading.
How to Use This Script:
This indicator is intended as a swiss army knife so you can find multiple ways how to use this.
Probably one of best ways to use this script is wait for a bullish or bearish Breaker Block to appear simultaneously or near-simultaneously with a Change of Character "Choch" in the same direction. Use other elements for confluence, such loss or regain of VWAP or its outer bands, state of the SuperTrend, etc. During day trades, this appears to be especially useful when price falls soon outside the 1st outer VWAP band and continues to close outside of it, suggesting a strong trend for the day.
The CCI indicators in the table are useful for showing both speed and momentum. Contrary to the common perception that CCI above 100+ is "overbought" or CCI below -100 is "oversold", you actually want to trade with, not against these conditions because it implies one side has control. The "CCI" in the table simply lists the current index position, whereas CCI is the 1st derivative of CCI (velocity), and the CCI more akin to an acceleration when CCI is extending beyond its bollinger band.
When viewing the daily timeframe, you will see Average Daily Range zones appear. These are useful as they tend to act as "support" and "resistance". A break through the upper or lower ADR zones within the opening minutes of the session indicates a strong breakout/breakdown. See Range Rush Reversal indicator by Kiakili on how to use ADR zones.
Note: This is version 5 script. The conversion to version 6 is not quite so simple as a click of a button.
Final Notes: Please, by all means test this code for algorithmic trading ala "Michael Automates" on Youtube. If you are an aspiring (or actual) statistical modeler, you should be generating multiple decision-tree-like flags to create triggering conditions for buying and selling (feature engineering. Try incorporate moving up stops), then iterate through different model fits to see what generates the highest net profit and profit factor at the lowest drawdown (there's a lot of target variables you could potentially create to model for). Then check for robustness by testing your model on multiple out-of-time vintages and on multiple asset classes. If they are great results, post your code and results here as a Strategy please!
I can be found at @sax_yak on Twitter (now X).

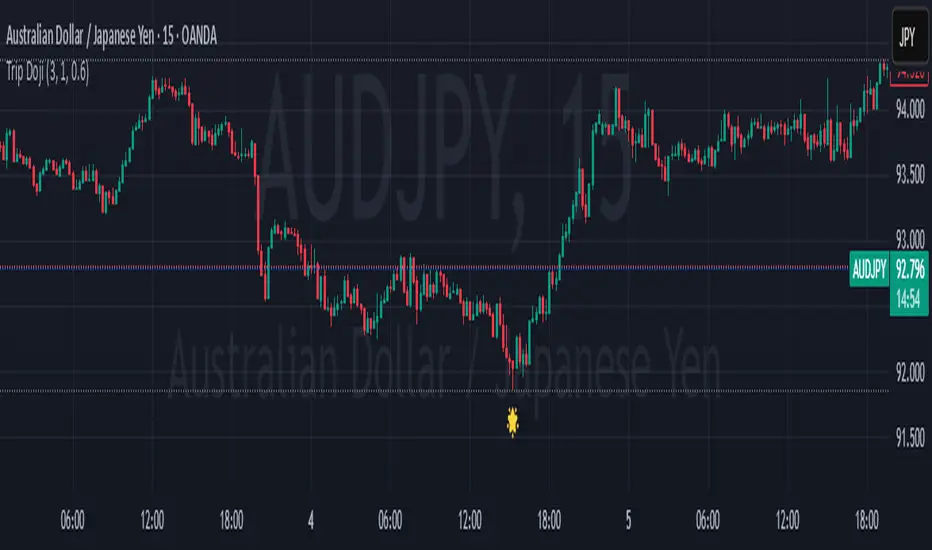
Triple Doji SequenceThe Triple Doji Sequence indicator helps traders identify consecutive Doji candlestick patterns, allowing them to choose between spotting single, double, or triple Dojis. A Doji is detected when the candle's body is small relative to its wicks, with either the upper or lower wick being significantly larger. Users can customize their own Doji criteria by adjusting the body size and wick dominance settings. The indicator ensures that consecutive Dojis align in the same direction before confirming a valid pattern, making it easier to identify market indecision or potential trend reversals.
When the chosen Doji sequence is detected, the indicator plots a star (*) above bearish Dojis (upper wick dominant) and below bullish Dojis (lower wick dominant). It also sends alerts when a valid sequence is confirmed at the close of the bar. This tool helps traders refine their strategy by spotting repeated Doji formations, which may indicate key turning points or continuation patterns in price action.
How to Use the Triple Doji Sequence Indicator?
Apply the Indicator:
Add the Triple Doji Sequence indicator to your TradingView chart.
It will automatically scan for Doji patterns based on your settings.
Customize Your Doji Criteria:
Adjust the body size and wick dominance settings to define what qualifies as a Doji.
Choose whether to detect single, double, or triple Doji sequences.
Interpret the Signals:
A star (*) above a candle signals a bearish Doji (upper wick dominant).
A star (*) below a candle signals a bullish Doji (lower wick dominant).
Set Up Alerts:
Enable alerts to receive notifications when a Doji sequence is confirmed at bar close.
Choose alert frequency based on your trading strategy (e.g., once per bar, once per bar close).
Use in Trading Strategy:
Doji sequences can indicate trend reversals or market indecision.
Combine this indicator with support/resistance levels, volume, or other indicators to confirm signals.
PS: Good luck in finding a Triple Doji :)

Daily (Gann Pivot)Daily Gann Pivot Indicator - Description
The **Daily (Gann Pivot) Indicator** is a custom **Pine Script** tool designed to calculate and display **Gann-based pivot levels** on a price chart. It utilizes past **high, low, and close** values to determine key support and resistance levels that traders can use for potential price movement analysis.
**Features & Functionality**
1. **Customizable Inputs:**
- Select **source type** (default: `open` price).
- Adjust **lookback period** (`Days Back` setting).
- Choose from various **timeframes** (D, 2D, 3D, weekly, monthly, etc.).
2. **Pivot & Support/Resistance Levels:**
- **Main Pivot Level** (calculated as the average of previous period's HLC).
- **Standard Support & Resistance Levels (S1, S2, S3, S4, R1, R2, R3, R4)**.
- **Intermediate Levels** based on Gann calculations (`TR1`, `TS1`, `TR2`, `TS2`).
3. **Custom Display Settings:**
- Toggle visibility for **Pivot, Support, and Resistance Levels**.
- Enable **labels** for different pivot levels with adjustable text sizes.
- Choose **line style** (Solid, Dashed, Dotted) and extension direction (Left, Right, Both, None).
4. **Dynamic Updates & Auto-Plotting:**
- Automatically updates pivot levels **daily**.
- Adjusts lines when new trading periods begin.
- Labels key price levels with **Gann angles** (e.g., 90º, 180º, 270º, 360º).
---
### **How It Works**
- The script calculates the pivot point and price range from the **previous period**.
- It derives **support and resistance levels** using Gann’s pivot theory.
- If enabled, the script **plots lines and labels** for visual clarity.
- It updates dynamically with **new bars** and adjusts lines accordingly.
---
### **Who Can Use It?**
- **Day Traders & Swing Traders** looking for precise support/resistance levels.
- **Technical Analysts** applying Gann’s methodology.
- **Price Action Traders** who use pivots for trade setups.
---
This indicator helps traders **identify critical price levels** and potential turning points in the market based on **Gann’s pivot calculations**. 🚀

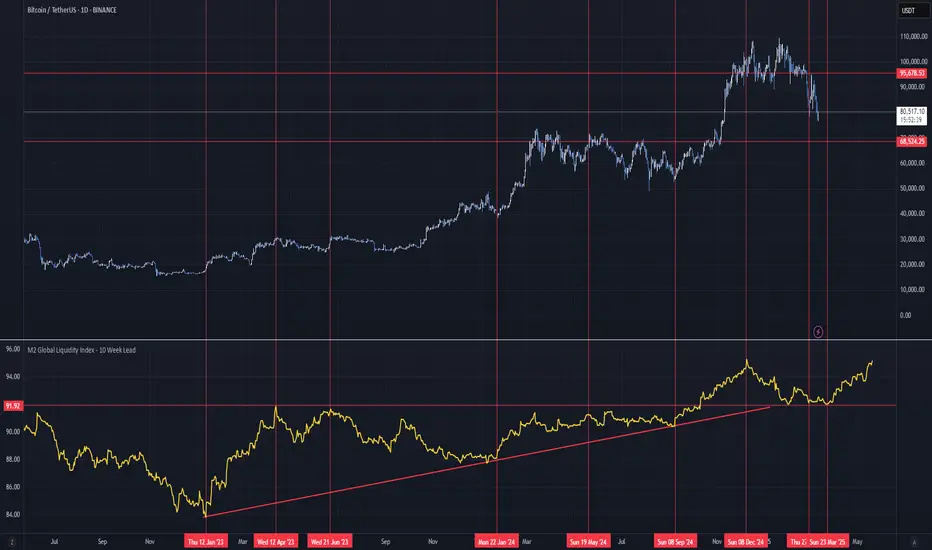
M2 Global Liquidity Index - 10 Week Lead
M2 Global Liquidity Index - Forward Projection (10 Weeks)
This indicator provides a 10-week forward projection of the M2 Global Liquidity Index, offering traders insight into potential future market conditions based on global money supply trends.
What This Indicator Shows
The M2 Global Liquidity Index aggregates M2 money stock data from five major economies:
- China (CNY)
- United States (USD)
- European Union (EUR)
- Japan (JPY)
- Great Britain (GBP)
All values are converted to USD and presented as a unified global liquidity metric, providing a comprehensive view of worldwide monetary conditions.
Forward Projection Feature
This adaptation displays the indicator 10 weeks ahead of the current price, allowing you to visualize potential future liquidity conditions that might influence market behavior. The projection maintains data integrity while providing an advanced view of the liquidity landscape.
Trading Applications
- Anticipate potential market reactions to changing global liquidity conditions
- Identify divergences between projected liquidity and current price action
- Develop longer-term strategic positions based on forward liquidity projections
- Enhance your macro-economic analysis toolkit
Credit
This indicator is an adaptation of the original "M2 Global Liquidity Index" created by Mik3Christ3ns3n. Full credit for the original concept and implementation goes to the original author. This version simply adds a 10-week forward projection to the existing calculations.
Disclaimer
This indicator is for informational purposes only and should be used as one of many tools in your analysis. Past performance and projections are not guarantees of future results.