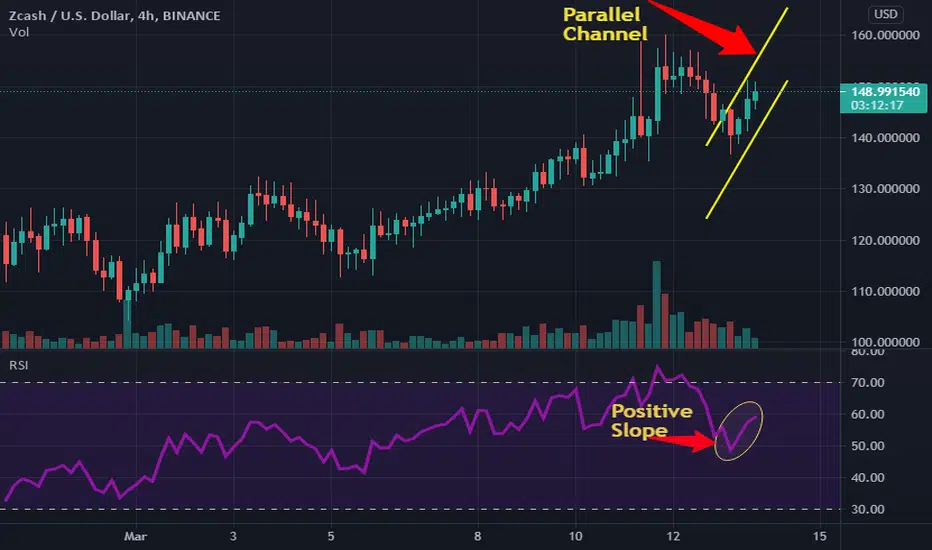
.The daily chart of ZEC hints at the start of a bullish move. On coming to the shorter time frame of 4 hours, the coin has formed a upward parallel channel. If the price breaks above 5% of the current position, it can see a rally upto $200 in upcoming trading sessions.ZEC price can also see a new low if it comes below the channel.
Kindly comment your thoughts below
Kindly comment your thoughts below
Powiązane publikacje
Wyłączenie odpowiedzialności
Informacje i publikacje przygotowane przez TradingView lub jego użytkowników, prezentowane na tej stronie, nie stanowią rekomendacji ani porad handlowych, inwestycyjnych i finansowych i nie powinny być w ten sposób traktowane ani wykorzystywane. Więcej informacji na ten temat znajdziesz w naszym Regulaminie.