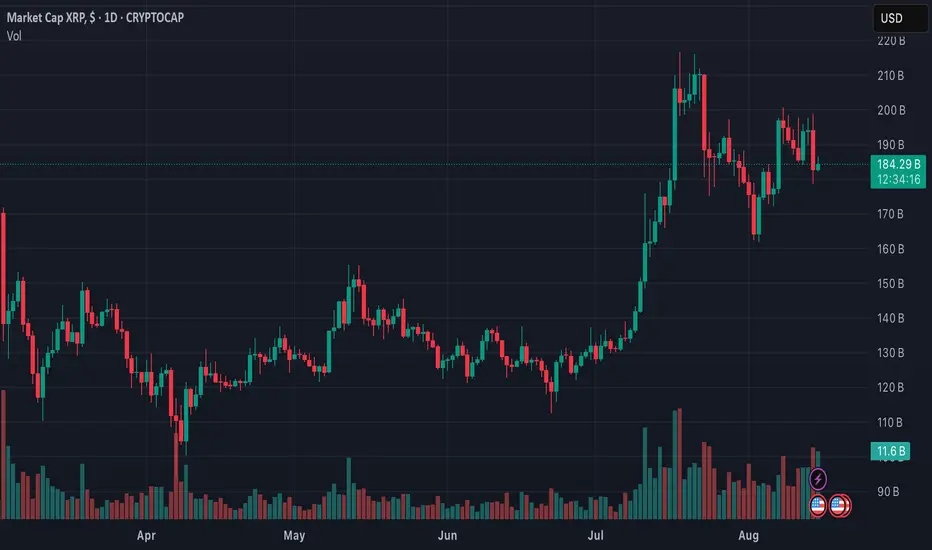
XRP remains in a well-defined uptrend, with the rising white trendline on the daily chart still intact. This confirms ongoing buyer strength. A break below this trendline would put the first key support at $3.12 in play; if that fails, the 50 EMA—a proven support in the past—comes into focus.
A potential inverse head-and-shoulders pattern is forming, but confirmation will only come if price clears the yellow resistance zone decisively. Such a breakout could unlock further upside potential. The MACD is showing waning negative momentum; a move into positive territory would strengthen the bullish case. The RSI is neutral, leaving room for a fresh trend move.
Liquidation data shows a neutral delta in the current range but a higher concentration of leveraged longs versus shorts. This could add fuel to the upside if price breaks higher—but also increase liquidation risk on sudden drops. As long as the trendline holds, the bullish structure remains intact.
⸻
Daily Chart – Key Levels:
Bullish:
• $3.40 – resistance (needs breakout for upside momentum)
• $3.60 – next target after breakout
• Confirmation of inverse H&S above yellow zone
Bearish:
• $3.12 – first support
• $50 EMA – medium-term key support
• $200 EMA – last major defense for the uptrend
⸻
4H Chart – Short-Term View:
In the short-term, XRP still holds a bullish market structure of higher highs and higher lows. Price has rejected twice at a notable resistance, highlighting its importance. The heatmap shows a strong liquidity cluster above $3.40; breaking it could unleash strong buying pressure.
On the downside, holding the 50 EMA is crucial to maintain momentum. A break lower targets the green support zone, with the 200 EMA as a final safeguard for the medium-term uptrend.
⸻
Analysis prepared by FORECK.INFO
Wyłączenie odpowiedzialności
Informacje i publikacje przygotowane przez TradingView lub jego użytkowników, prezentowane na tej stronie, nie stanowią rekomendacji ani porad handlowych, inwestycyjnych i finansowych i nie powinny być w ten sposób traktowane ani wykorzystywane. Więcej informacji na ten temat znajdziesz w naszym Regulaminie.
