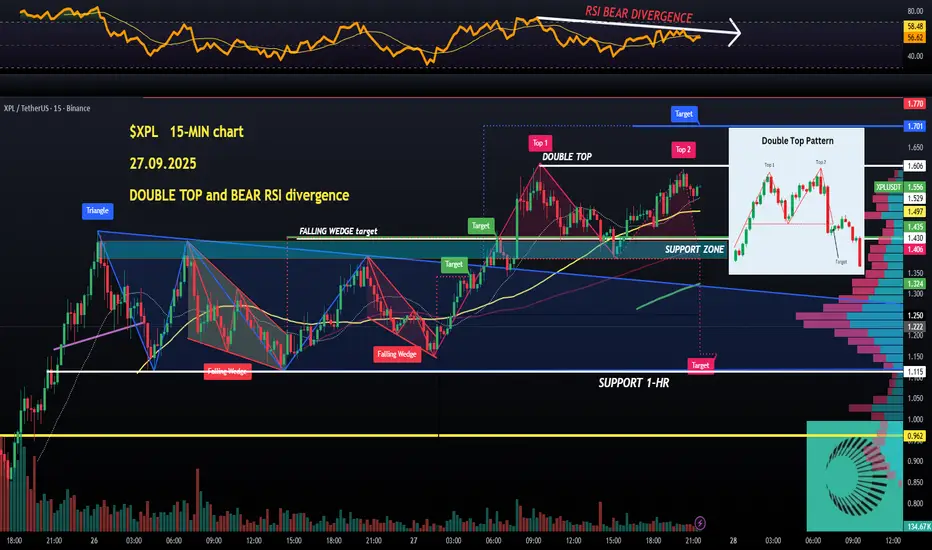
Okay,  XPL is finally showing first signs of losing steam after hitting a DOUBLE TOP with bearish RSI divergence (equal high on price, and lower high on RSI = weakening momentum).
Support zone: $1.38 (also the DOUBLE TOP's neckline, breakdown below would target $1.15) up to $1.43 (previous rejections from this level as resistance, flipped).
The double TOP doesn't mean a reversal is here, but surely works as a red flag.
I will try and buy at discount prices between $1.10 and $1.15, in case of a breakdown or another Sunday nite bloodbath.
No longs for me yet, but they will come💙👽
Wyłączenie odpowiedzialności
Informacje i publikacje nie stanowią i nie powinny być traktowane jako porady finansowe, inwestycyjne, tradingowe ani jakiekolwiek inne rekomendacje dostarczane lub zatwierdzone przez TradingView. Więcej informacji znajduje się w Warunkach użytkowania.
Wyłączenie odpowiedzialności
Informacje i publikacje nie stanowią i nie powinny być traktowane jako porady finansowe, inwestycyjne, tradingowe ani jakiekolwiek inne rekomendacje dostarczane lub zatwierdzone przez TradingView. Więcej informacji znajduje się w Warunkach użytkowania.