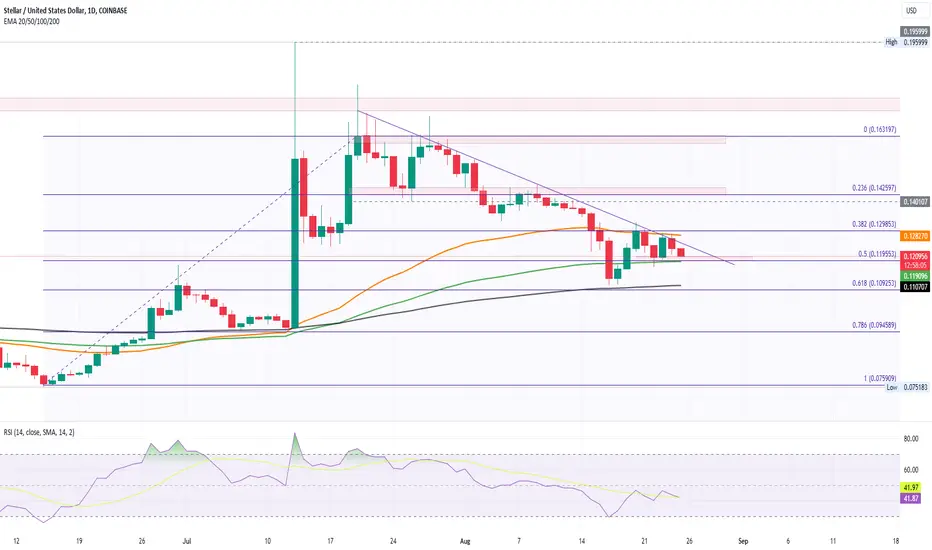
XLM price moves sideways between 50 and 100-day EMA.
Resistance trendline indicates strong selling pressure.
Break below 100-day EMA could push XLM below $0.10.
XLM faces significant resistance at $0.16, with sellers controlling bullish momentum.
Downtrend exerts pressure on 100 and 200-day EMA.
Price trapped between 50% and 38.2% Fibonacci levels, consolidating between $0.119-$0.129.
Intraday fall of 2.15% sees XLM testing $0.119 support.
Breakout from current Fibonacci levels will indicate next move.
Potential double top formation suggests possible downtrend.
If price drops below 100-day EMA, 200-day EMA buyers may step in, stressing the $0.10 mark.
Bullish scenario: If XLM breaks 50-day EMA, it could target $0.142.
Wyłączenie odpowiedzialności
Informacje i publikacje przygotowane przez TradingView lub jego użytkowników, prezentowane na tej stronie, nie stanowią rekomendacji ani porad handlowych, inwestycyjnych i finansowych i nie powinny być w ten sposób traktowane ani wykorzystywane. Więcej informacji na ten temat znajdziesz w naszym Regulaminie.