✅From the 4H chart, gold experienced a strong bullish rally after breaking above the 4077 pivot level and reached a recent high of 4148.99.
However, after consecutive bullish candles, the price faced resistance near the upper Bollinger Band (4154.85) and has since pulled back slightly.
Currently, the price is hovering near 4110–4115, just above the MA10 (4104.83) and MA20 (4051.26) — this area serves as a short-term support zone.
The Bollinger Bands remain in an expanding state, indicating that overall volatility is still active.
If the price stabilizes above 4105–4110, the bullish structure remains intact; a break below this zone could trigger further pullback toward 4077–4050.
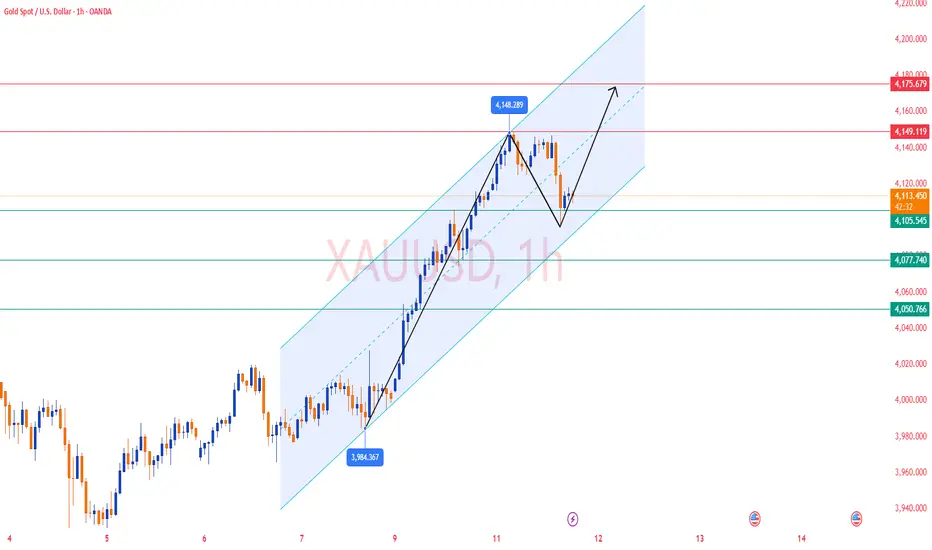
✅On the 1H timeframe, gold shows a short-term correction after peaking at 4148.
MA5 and MA10 have formed a bearish crossover, and the price is currently below them, signaling short-term bearish pressure.
Bollinger Bands are starting to narrow, reflecting decreasing volatility and a possible sideways consolidation phase.
The MACD has formed a dead cross, and the momentum indicator shows continued downside pressure, but near-term support appears around 4107–4090.
🔴 Resistance levels: 4148 / 4155 / 4175
🟢 Support levels: 4105 / 4077 / 4050
✅ Trading Strategy Reference
🔰 If gold rebounds to 4145–4148 and faces resistance, consider light short positions, targeting 4105–4077, with a stop loss above 4155.
🔰 If gold drops to 4100–4110 and stabilizes, consider short-term long positions, targeting 4130–4150, with a stop loss below 4065.
📈The overall structure remains bullish on higher timeframes, but short-term correction pressure is visible.
In the near term, focus on the 4100–4145 trading range — sell high, buy low within the band, and wait for a clear breakout to determine the next major direction.
However, after consecutive bullish candles, the price faced resistance near the upper Bollinger Band (4154.85) and has since pulled back slightly.
Currently, the price is hovering near 4110–4115, just above the MA10 (4104.83) and MA20 (4051.26) — this area serves as a short-term support zone.
The Bollinger Bands remain in an expanding state, indicating that overall volatility is still active.
If the price stabilizes above 4105–4110, the bullish structure remains intact; a break below this zone could trigger further pullback toward 4077–4050.
✅On the 1H timeframe, gold shows a short-term correction after peaking at 4148.
MA5 and MA10 have formed a bearish crossover, and the price is currently below them, signaling short-term bearish pressure.
Bollinger Bands are starting to narrow, reflecting decreasing volatility and a possible sideways consolidation phase.
The MACD has formed a dead cross, and the momentum indicator shows continued downside pressure, but near-term support appears around 4107–4090.
🔴 Resistance levels: 4148 / 4155 / 4175
🟢 Support levels: 4105 / 4077 / 4050
✅ Trading Strategy Reference
🔰 If gold rebounds to 4145–4148 and faces resistance, consider light short positions, targeting 4105–4077, with a stop loss above 4155.
🔰 If gold drops to 4100–4110 and stabilizes, consider short-term long positions, targeting 4130–4150, with a stop loss below 4065.
📈The overall structure remains bullish on higher timeframes, but short-term correction pressure is visible.
In the near term, focus on the 4100–4145 trading range — sell high, buy low within the band, and wait for a clear breakout to determine the next major direction.
Wyłączenie odpowiedzialności
Informacje i publikacje nie stanowią i nie powinny być traktowane jako porady finansowe, inwestycyjne, tradingowe ani jakiekolwiek inne rekomendacje dostarczane lub zatwierdzone przez TradingView. Więcej informacji znajduje się w Warunkach użytkowania.
Wyłączenie odpowiedzialności
Informacje i publikacje nie stanowią i nie powinny być traktowane jako porady finansowe, inwestycyjne, tradingowe ani jakiekolwiek inne rekomendacje dostarczane lub zatwierdzone przez TradingView. Więcej informacji znajduje się w Warunkach użytkowania.