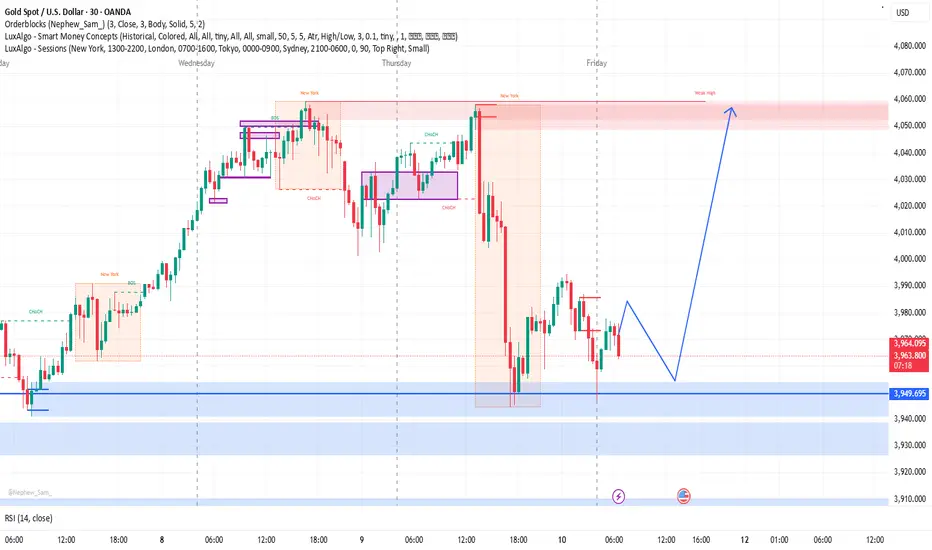
The chart shows the 30-minute timeframe of XAU/USD (Gold Spot vs. U.S. Dollar) with a clear Smart Money Concepts (SMC) analysis using LuxAlgo indicators. The market recently experienced a sharp drop after hitting a resistance zone marked by an order block and a weak high near the 3,976 level. Currently, the price is retracing after tapping into a strong demand zone around 3,947–3,950, suggesting potential bullish interest. The projected blue line indicates a possible bullish move after a short-term retracement, aiming for a return to the previous high. The RSI at around 43 signals neutral momentum, supporting the possibility of either consolidation or a reversal from this key support area.
Wyłączenie odpowiedzialności
Informacje i publikacje nie stanowią i nie powinny być traktowane jako porady finansowe, inwestycyjne, tradingowe ani jakiekolwiek inne rekomendacje dostarczane lub zatwierdzone przez TradingView. Więcej informacji znajduje się w Warunkach użytkowania.
Wyłączenie odpowiedzialności
Informacje i publikacje nie stanowią i nie powinny być traktowane jako porady finansowe, inwestycyjne, tradingowe ani jakiekolwiek inne rekomendacje dostarczane lub zatwierdzone przez TradingView. Więcej informacji znajduje się w Warunkach użytkowania.