Brief technical analysis
1. General structure and main dynamics
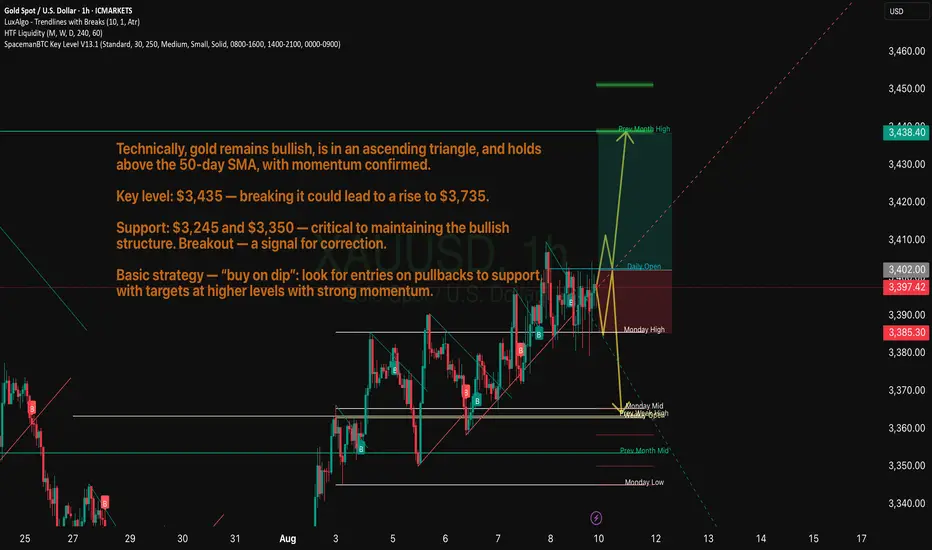
Gold is trading in an ascending triangle, a bullish pattern indicating potential for further gains. The price has consolidated above the 50-day moving average, and the RSI is reinforcing the bullish sentiment.
The MACD and RSI (≈ 54.7) are signaling growing positive momentum, especially after the rebound from the lower Bollinger band and the formation of EMA-8/EMA-21 crosses.
Citi has raised its forecast to $3,300-3,600 over the next three months, given the weak US economy and the weakening dollar.
Yesterday, gold prices were close to a multi-year high near $3,400. A break of resistance around $3,435 could bring gains to the target of $3,735 (according to the “measured move” pattern).
However, an HSBC analyst warns of weakness in momentum; a pullback after growth is possible, especially with an improving global background and a delayed tightening by the Fed.
2. Key levels
Resistance:
~$3,435 — the top of the ascending triangle
If broken — potential target $3,735
Investopedia
Support:
~$3,245 — the lower boundary of the structure and the zone of a possible pullback
Next — ~$3,150 with further sales
50-day SMA: ~$3,350 — a critical level for maintaining the bullish scenario
1. General structure and main dynamics
Gold is trading in an ascending triangle, a bullish pattern indicating potential for further gains. The price has consolidated above the 50-day moving average, and the RSI is reinforcing the bullish sentiment.
The MACD and RSI (≈ 54.7) are signaling growing positive momentum, especially after the rebound from the lower Bollinger band and the formation of EMA-8/EMA-21 crosses.
Citi has raised its forecast to $3,300-3,600 over the next three months, given the weak US economy and the weakening dollar.
Yesterday, gold prices were close to a multi-year high near $3,400. A break of resistance around $3,435 could bring gains to the target of $3,735 (according to the “measured move” pattern).
However, an HSBC analyst warns of weakness in momentum; a pullback after growth is possible, especially with an improving global background and a delayed tightening by the Fed.
2. Key levels
Resistance:
~$3,435 — the top of the ascending triangle
If broken — potential target $3,735
Investopedia
Support:
~$3,245 — the lower boundary of the structure and the zone of a possible pullback
Next — ~$3,150 with further sales
50-day SMA: ~$3,350 — a critical level for maintaining the bullish scenario
Powiązane publikacje
Wyłączenie odpowiedzialności
Informacje i publikacje przygotowane przez TradingView lub jego użytkowników, prezentowane na tej stronie, nie stanowią rekomendacji ani porad handlowych, inwestycyjnych i finansowych i nie powinny być w ten sposób traktowane ani wykorzystywane. Więcej informacji na ten temat znajdziesz w naszym Regulaminie.