📌 Key Market Drivers
Federal Reserve Policy Expectations
The market is pricing in the possibility of a September rate cut, focusing on this week's FOMC meeting minutes and Powell's speech at the Jackson Hole symposium.
Two 25 basis point rate cuts are expected this year, but policy confirmation is needed.
A strong dollar is suppressing gold's potential rebound.
Geopolitics (Russia-Ukraine situation)
Putin and Zelensky may meet, raising market hopes for a easing of tensions.
Weakened safe-haven demand is limiting gold's upside.
📊 Technical Analysis
🔹 Medium-Term Trend (Weekly/Monthly)
A series of dojis on the monthly chart indicates a weakening of bullish momentum.
A pullback is a sell signal, with medium-term targets ranging from 3245 to 3150-3120 and then to 3000-2950.
The overall trend remains bearish, but be wary of short-term rebound corrections.
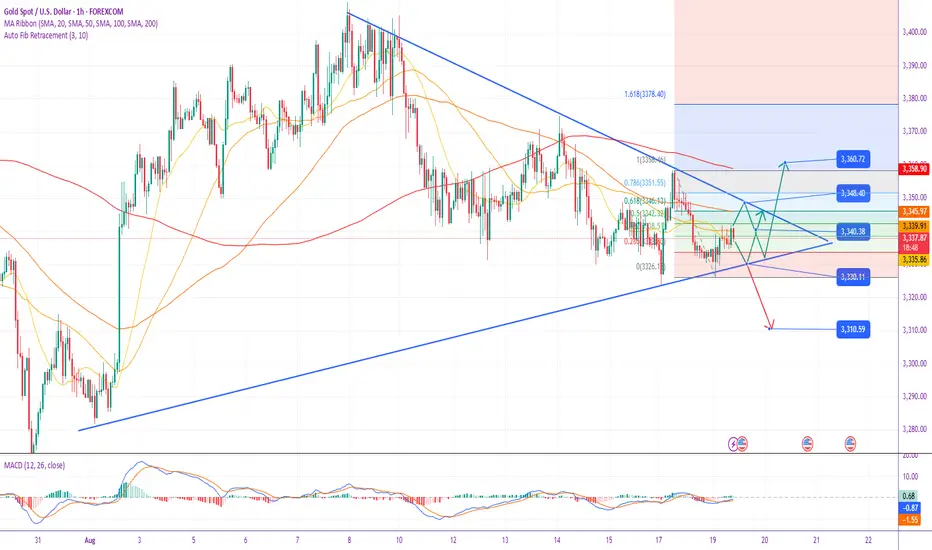
🔹 Short-Term Trend (4H/1H)
Key Support Zone:
3324 (Monday's low + early trading breakout point)
3315 → 3300 (psychological barrier)
3270 (next short-term target)
Key Resistance Zone:
3340 (short-term strength/weakness dividing line)
3358-3360 (yesterday's high, short-term defense)
3375 → 3390 (strong resistance, rebound limit)
🔎 Current Market Characteristics:
A rapid drop to 3324 (near the 0.618 golden ratio at 3322) in early Asian trading followed by a rebound, consistent with a technical correction.
Rebound high encountered resistance at 3341, indicating a lack of bullish momentum.
Volatility is narrowing, and the market awaits guidance from the FOMC minutes and Powell's speech.
🎯 Today's Trading Strategy
▶ Key Ideas: Focus on rebounds and short positions. Short positions can be pursued if key support levels are broken.
Aggressive short positions (suitable for short-term traders)
Entry: Strategize in batches between 3350 and 3358
Stop-loss: Above 3360 (wait and see if it breaks through)
Target: 3324 → 3315 → 3300
Conservative short positions (If it rebounds to this position, go short)
Entry: 3370-3375 or 3390 (if it rebounds there)
Stop-loss: Above 3400
Target: 3350 → 3324 → 3300
Short positions can be pursued if weakness is confirmed.
Follow short positions with a small position after breaking below 3324, targeting 3315 → 3300.
If the price accelerates below 3300, the downside potential will open up to 3270.
Caution in long positions (short-term only)
If the price stabilizes after a pullback between 3324 and 3322, a small position can be used to try to capitalize on a rebound.
Target 3340 → 3358, quick in and out
⚠️ Risk Warning
FOMC meeting minutes and Powell's speech may trigger significant volatility.
A sudden deterioration in the situation between Russia and Ukraine could trigger safe-haven buying.
3360 is the bull-bear watershed; a break above it would signal short-term strength.
📌 Summary
Short-term: Focus on the 3340-3360 resistance zone, Short sell when rebounding to high level
Mid-term: Maintain a bearish outlook; upward movement remains a short-selling opportunity.
Key Points:
Support: 3324 → 3315 → 3300
Resistance: 3340 → 3360 → 3375
(Traders are advised to maintain strict stop-loss orders and respond flexibly to breaking news.)
Zlecenie aktywne
Comprehensive Analysis of the Latest Gold Market Trends (August 20, 2025)
I. Technical Analysis: Short-term Pressure, Key Positions Under Conflict
The technical analysis (oscillating bearish trend) is consistent with the current market performance.
Daily Chart:
"Shooting Star" candlestick pattern: Yesterday's long upper shadow doji (shooting star) is a typical short-term topping reversal signal. It indicates that after attempting an upward move, bulls were ultimately completely suppressed by bearish forces and driven back to the starting point, with heavy selling pressure from above.
Trend Analysis: Gold prices failed to effectively break through the previous high and instead retreated at key resistance levels, confirming a short-term, oscillating, weak pattern. Overall, the price remains in a consolidation range at a high level, but the center of gravity is trending downward.
1-Hour/4-Hour Chart (Short-Term Trend):
Key Resistance Zone: The $3348-3358 area has become a solid short-term resistance zone. Yesterday's repeated attempts to push upward failed to gain traction, and the early morning rebound was also capped below this area. Key Support Zone: The $3310-3300 range is the recent core support platform. A break below this level would confirm an acceleration of the downward trend, opening up further downside potential (e.g., towards the $3280-3250 area).
III. Overall Views and Trading Recommendations
Core View: In the short term, easing geopolitical risks are the primary driver of the gold price correction. Technical indicators also show signs of a weakening upward trend and a pullback under pressure. Market focus is shifting to the Jackson Hole Annual Meeting, seeking new guidance on the Federal Reserve's policy direction. Until gold prices effectively break through key technical levels, the overall strategy favors a volatile downward trend.
Specific Trading Strategies:
Short on Rebounds (Primary Strategy):
Ideal Entry Zone: $3345-3355.
Stop-loss Setting: Conservatives can set it above $3360; aggressive traders can set it above $3358.
Target Target: $3325 → $3310 → $3300. After breaking below $3300, consider holding and looking for lower levels.
Long on pullbacks (minor strategy, caution required):
Ideal entry area: Strong support between $3310 and $3300. Remember not to buy the dip prematurely; wait until the price reaches support and shows signs of stabilization (such as a bullish close on the 1-hour chart or a lower shadow).
Stop-loss: Below $3295.
Target: $3325-3335 (short-term rebound).
Summary: For today's trading, prioritize shorting on rallies near the $3348-3358 resistance zone, targeting support targets below. The long position is only to catch the rebound of the key support level, which is a counter-trend operation. It has extremely high requirements for the entry point and stop-loss discipline. Please participate with caution and light positions.
❤️Free gold trading signals:t.me/+7W6lfjoqQ-Y2NjU0
🥇Gold price trend analysis and forecast
💹Technical analysis (K-line patterns, trend lines, indicator systems)
✅Gold's safe-haven properties and asset allocation strategy
🥇Gold price trend analysis and forecast
💹Technical analysis (K-line patterns, trend lines, indicator systems)
✅Gold's safe-haven properties and asset allocation strategy
Wyłączenie odpowiedzialności
Informacje i publikacje przygotowane przez TradingView lub jego użytkowników, prezentowane na tej stronie, nie stanowią rekomendacji ani porad handlowych, inwestycyjnych i finansowych i nie powinny być w ten sposób traktowane ani wykorzystywane. Więcej informacji na ten temat znajdziesz w naszym Regulaminie.