https://www.tradingview.com/x/S09EQbdK/
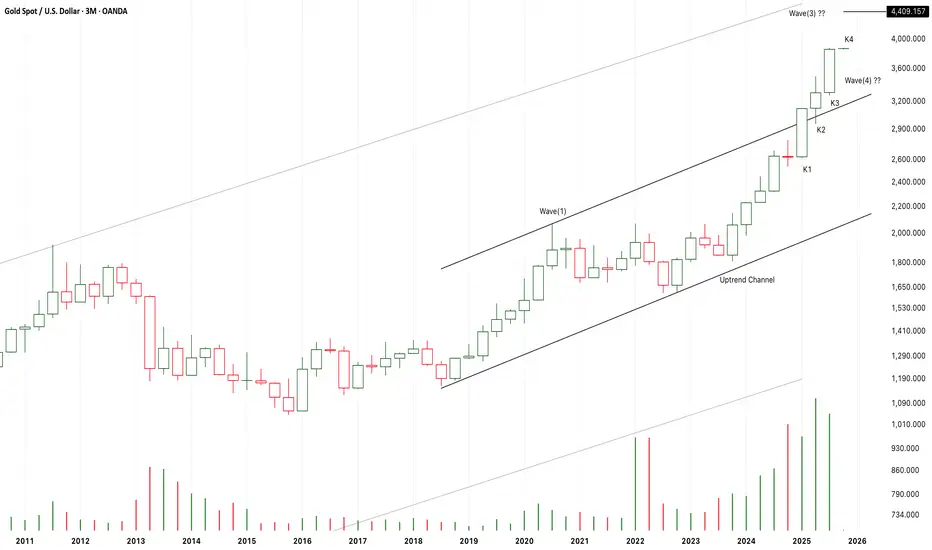
After K1 breaking up the uptrend channel,
The market accelerate to get away from the Channel.
Both the increasing demands and the expanding candle body verified the strength of the potential bullish wave(3).
Perhaps, K4 will keep climbing up to get to the end of wave(3) at about 4.4K area.
If I bought it earlier,
I will try to decrease my long-term positions there.
Of course,
The expensive metals are still in the long-term bull market,
At least, it will last for one more year.
Uwaga
From K7 to K9,
It is a three soldiers advancing pattern,
It verified a bullish market.
A nearest resistance at about 4600-5000USD area.
I will keep cutting off my leverage positions from 4200-5000USD to avoid a potential risk of a retreat.
I have leverage positions at XAUT\SHNY\AGQ.
A 30% sharp drop happened at the perpetual contract(PAXG/USDT) of Binance Market.
The price shock started from 3000USD to 5100USD.
It is really a disaster to the contract traders.
I am expecting a retest to the 4000USD area months later.
I will try to buy back then.
Wyłączenie odpowiedzialności
Informacje i publikacje przygotowane przez TradingView lub jego użytkowników, prezentowane na tej stronie, nie stanowią rekomendacji ani porad handlowych, inwestycyjnych i finansowych i nie powinny być w ten sposób traktowane ani wykorzystywane. Więcej informacji na ten temat znajdziesz w naszym Regulaminie.