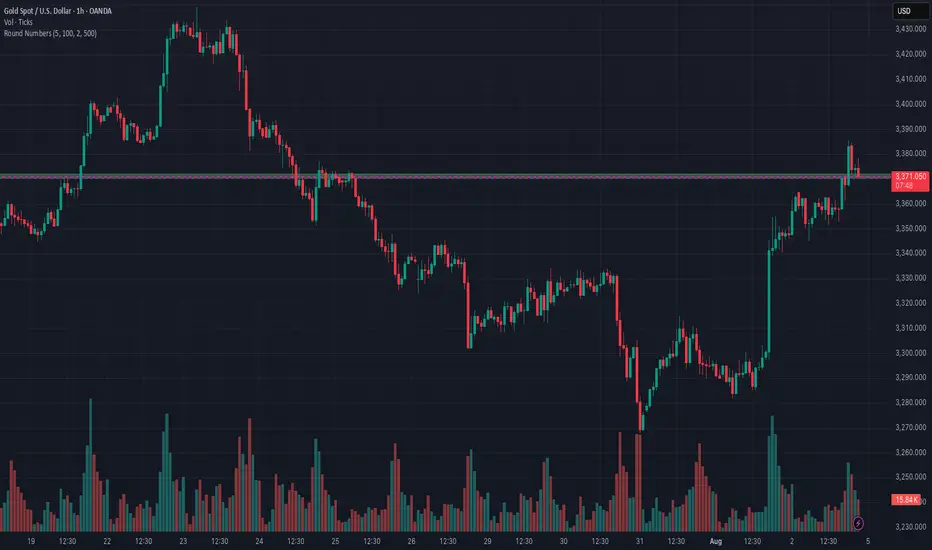
This chart highlights key price areas using two important indicators:
🔹 Volume – Helps identify high-activity zones where buyers and sellers are most engaged. Spikes in volume often signal strong interest or potential reversals.
🔹 Round Numbers – Psychological levels (e.g., 100, 500, 1000) where price tends to react due to trader bias. These act as natural support/resistance zones.
📊 Use Case:
Look for volume spikes near round numbers to find high-probability reversal or breakout setups.
Combine this with price action for better entry/exit signals.
🧠 Tip: Round number zones with strong volume support often act as key levels during trend continuation or reversal.
Wyłączenie odpowiedzialności
Informacje i publikacje przygotowane przez TradingView lub jego użytkowników, prezentowane na tej stronie, nie stanowią rekomendacji ani porad handlowych, inwestycyjnych i finansowych i nie powinny być w ten sposób traktowane ani wykorzystywane. Więcej informacji na ten temat znajdziesz w naszym Regulaminie.