✨ Quick Summary:
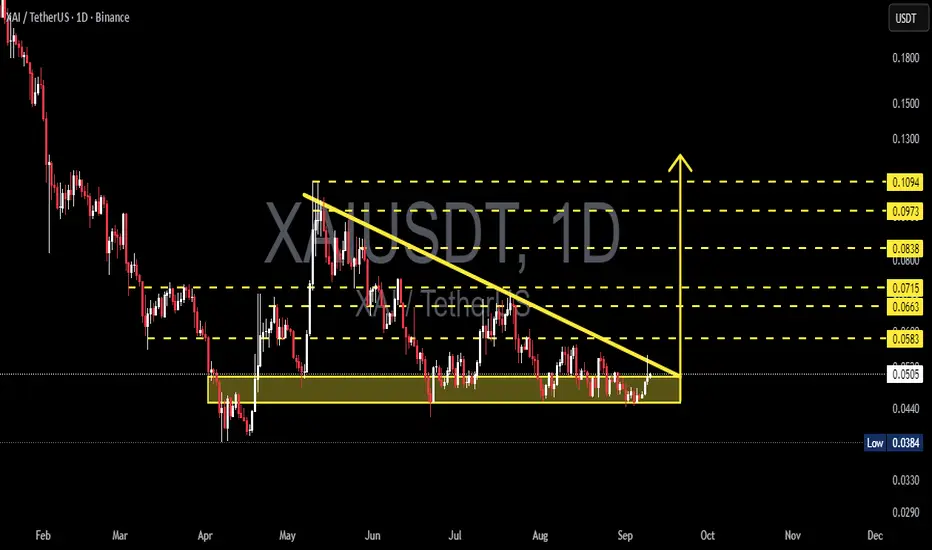
The XAI/USDT chart is now at a critical decision point. For months, price has been consolidating inside the accumulation zone (0.0384 – 0.050), while being consistently pressured by a descending trendline from above. This structure forms a descending triangle, a pattern that often signals bearish continuation, but can also act as a powerful reversal base if a breakout occurs with strong volume.
Currently, price trades around 0.0504, right at the crossroads of major support and the seller’s pressure line. This means an explosive move — either a breakout or breakdown — is likely coming soon.
---
🔎 Chart Pattern & Price Structure
Support Zone (yellow box): 0.0384 – 0.050 → tested multiple times since April 2025, showing strong buyer defense.
Descending Trendline Resistance (yellow line): connecting lower highs since May, pressing price downward.
Pattern: Classic Descending Triangle → market is coiling tighter, awaiting a catalyst.
Market Psychology:
Buyers keep defending the same support.
Sellers consistently lower their asking prices.
This tug-of-war is reaching its breaking point.
---
🚀 Bullish Scenario (Breakout)
Key confirmation:
Daily close above the descending trendline.
Breakout and daily close above 0.0583 with significant volume.
Potential upside targets (layered resistances):
🎯 Target 1: 0.0583 (+15%)
🎯 Target 2: 0.0663 (+31%)
🎯 Target 3: 0.0715 (+42%)
🎯 Target 4: 0.0838 (+66%)
🎯 Target 5: 0.0973 (+93%)
🎯 Ambitious Target: 0.1094 (+117%)
Trading notes:
Strong breakouts often come with at least 2x average daily volume. The ideal setup is breakout → retest (turning resistance into support) → continuation. Conservative entries can wait for the retest confirmation above 0.0583.
---
⚠️ Bearish Scenario (Breakdown)
Key confirmation: daily close below 0.0384 with a full-bodied candle and high volume.
Downside risk:
Retest of the psychological support zone 0.033 – 0.030.
Breakdown here would likely extend the broader bearish trend, potentially setting new lows.
Trading notes:
A breakdown with volume often triggers panic selling. In this case, stop-losses for longs become crucial. Aggressive traders may consider shorts after a failed retest of broken support.
---
🔑 Extra Confirmation Factors
1. Volume: No volume = no trust in breakout/breakdown.
2. RSI / Momentum: Bullish divergence supports a breakout, bearish divergence confirms breakdown.
3. Market Sentiment: If BTC/ETH trend bullish, XAI’s breakout chances improve. A weak crypto market favors breakdown.
4. Fundamental Catalysts: Partnerships, project updates, or listings can flip the technical outlook.
---
📌 Conclusion
XAI/USDT is facing a make-or-break moment:
Bullish breakout could open a +40% to +100% rally.
Bearish breakdown could drag price back to the 0.030–0.033 zone.
For traders: this is the time to wait for confirmation. Entering too early in such a setup carries high risk. The best positions often come after the market chooses its direction.
---
#XAI #XAIUSDT #CryptoAnalysis #TechnicalAnalysis #DescendingTriangle #Altcoin #Breakout #SupportResistance #CryptoTrading
✅ Get Free Signals! Join Our Telegram Channel Here: t.me/TheCryptoNuclear
✅ Twitter: twitter.com/crypto_nuclear
✅ Join Bybit : partner.bybit.com/b/nuclearvip
✅ Benefits : Lifetime Trading Fee Discount -50%
✅ Twitter: twitter.com/crypto_nuclear
✅ Join Bybit : partner.bybit.com/b/nuclearvip
✅ Benefits : Lifetime Trading Fee Discount -50%
Wyłączenie odpowiedzialności
Informacje i publikacje przygotowane przez TradingView lub jego użytkowników, prezentowane na tej stronie, nie stanowią rekomendacji ani porad handlowych, inwestycyjnych i finansowych i nie powinny być w ten sposób traktowane ani wykorzystywane. Więcej informacji na ten temat znajdziesz w naszym Regulaminie.