📈 WTI CRUDE OIL (USOIL) – SWING TRADE SETUP | VWMA BREAKOUT CONFIRMED 🛢️⚡
🎯 TRADE OVERVIEW
Asset: WTI Crude Oil (USOIL) – Energies Market
Trade Type: Swing Trade (Multi-Day Position)
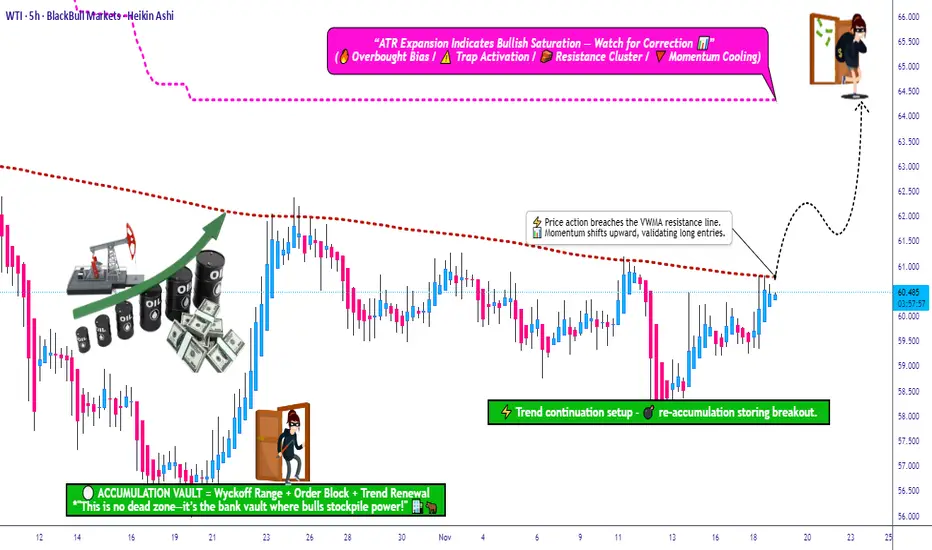
Bias: 🟢 BULLISH – Volume Weighted Moving Average (VWMA) breakout confirmed near $61.00
📊 TRADE PLAN
🔹 Entry Strategy: "Thief Layering Method"
Primary Entry Zone: Post-VWMA breakout above $61.00
Layered Limit Orders (Multiple Entry Points):
🟦 Layer 1: $59.00
🟦 Layer 2: $59.50
🟦 Layer 3: $60.00
🟦 Layer 4: $60.50
Note: You can add more layers based on your capital allocation and risk tolerance. This strategy allows averaging into the position as price pulls back.
🛑 Stop Loss Management
Thief's SL: $58.00
⚠️ IMPORTANT: Dear Ladies & Gentlemen (Thief OG's),
This is MY stop loss level. Adjust YOUR stop loss based on YOUR strategy and risk management plan. I do not recommend blindly following my SL – manage your own risk and capital accordingly.
🎯 Take Profit Target
Primary Target: $64.00
Technical Reasoning:
SuperTrend ATR line acts as strong dynamic resistance
Potential overbought zone + bull trap risk
Escape with profits before reversal pressure
⚠️ IMPORTANT: Dear Ladies & Gentlemen (Thief OG's),
This is MY take profit target. Take YOUR money at YOUR own risk. You are responsible for your profit-taking strategy – trail stops, scale out, or exit fully based on YOUR trading plan.
🔗 CORRELATED PAIRS TO WATCH (USD-Denominated)
Monitor these related assets for confirmation and risk assessment:
🛢️ Energy Sector:
Brent Crude Oil (UKOIL) – Typically trades $2-5 above WTI; if Brent is bullish, WTI usually follows
Natural Gas (NATGAS) – Energy sector sentiment indicator
💵 Currency Pairs:
USD/CAD – Inverse correlation to oil (CAD = petro-currency). If oil rises, USD/CAD typically falls
DXY (US Dollar Index) – Strong dollar = bearish pressure on oil. Watch for weakness in DXY to support oil rally
📈 Equity Markets:
Energy Sector ETFs (XLE) – Tracks US energy stocks; bullish XLE confirms oil sector strength
S&P 500 (SPX) – Risk-on sentiment supports commodity prices
⚡ Key Correlation Points:
Oil ↑ + USD/CAD ↓ = Strong bullish confirmation
Oil ↑ + DXY ↓ = Supportive macro environment
Oil ↑ + XLE ↑ = Energy sector momentum aligned
💬 Engagement Call-to-Action
👍 If you found this analysis helpful, smash that LIKE button!
💬 Drop your thoughts in the comments – are you bullish or bearish on oil?
🔔 FOLLOW for more professional trade setups and market insights!
🎯 TRADE OVERVIEW
Asset: WTI Crude Oil (USOIL) – Energies Market
Trade Type: Swing Trade (Multi-Day Position)
Bias: 🟢 BULLISH – Volume Weighted Moving Average (VWMA) breakout confirmed near $61.00
📊 TRADE PLAN
🔹 Entry Strategy: "Thief Layering Method"
Primary Entry Zone: Post-VWMA breakout above $61.00
Layered Limit Orders (Multiple Entry Points):
🟦 Layer 1: $59.00
🟦 Layer 2: $59.50
🟦 Layer 3: $60.00
🟦 Layer 4: $60.50
Note: You can add more layers based on your capital allocation and risk tolerance. This strategy allows averaging into the position as price pulls back.
🛑 Stop Loss Management
Thief's SL: $58.00
⚠️ IMPORTANT: Dear Ladies & Gentlemen (Thief OG's),
This is MY stop loss level. Adjust YOUR stop loss based on YOUR strategy and risk management plan. I do not recommend blindly following my SL – manage your own risk and capital accordingly.
🎯 Take Profit Target
Primary Target: $64.00
Technical Reasoning:
SuperTrend ATR line acts as strong dynamic resistance
Potential overbought zone + bull trap risk
Escape with profits before reversal pressure
⚠️ IMPORTANT: Dear Ladies & Gentlemen (Thief OG's),
This is MY take profit target. Take YOUR money at YOUR own risk. You are responsible for your profit-taking strategy – trail stops, scale out, or exit fully based on YOUR trading plan.
🔗 CORRELATED PAIRS TO WATCH (USD-Denominated)
Monitor these related assets for confirmation and risk assessment:
🛢️ Energy Sector:
Brent Crude Oil (UKOIL) – Typically trades $2-5 above WTI; if Brent is bullish, WTI usually follows
Natural Gas (NATGAS) – Energy sector sentiment indicator
💵 Currency Pairs:
USD/CAD – Inverse correlation to oil (CAD = petro-currency). If oil rises, USD/CAD typically falls
DXY (US Dollar Index) – Strong dollar = bearish pressure on oil. Watch for weakness in DXY to support oil rally
📈 Equity Markets:
Energy Sector ETFs (XLE) – Tracks US energy stocks; bullish XLE confirms oil sector strength
S&P 500 (SPX) – Risk-on sentiment supports commodity prices
⚡ Key Correlation Points:
Oil ↑ + USD/CAD ↓ = Strong bullish confirmation
Oil ↑ + DXY ↓ = Supportive macro environment
Oil ↑ + XLE ↑ = Energy sector momentum aligned
💬 Engagement Call-to-Action
👍 If you found this analysis helpful, smash that LIKE button!
💬 Drop your thoughts in the comments – are you bullish or bearish on oil?
🔔 FOLLOW for more professional trade setups and market insights!
💰 Money-Making Analysis
• Forex💹
• Indices📈
• Crypto ₿
• Commodities⚡
• Stocks🏦
• Fundamental + Macro📊
• Sentiment🔎
👉 Ask what analysis you need & get it FREE!
Join Discord for signals + data & grab the Master Plan: discord.gg/ZQS3y7FhVr
• Forex💹
• Indices📈
• Crypto ₿
• Commodities⚡
• Stocks🏦
• Fundamental + Macro📊
• Sentiment🔎
👉 Ask what analysis you need & get it FREE!
Join Discord for signals + data & grab the Master Plan: discord.gg/ZQS3y7FhVr
Powiązane publikacje
Wyłączenie odpowiedzialności
Informacje i publikacje nie stanowią i nie powinny być traktowane jako porady finansowe, inwestycyjne, tradingowe ani jakiekolwiek inne rekomendacje dostarczane lub zatwierdzone przez TradingView. Więcej informacji znajduje się w Warunkach użytkowania.