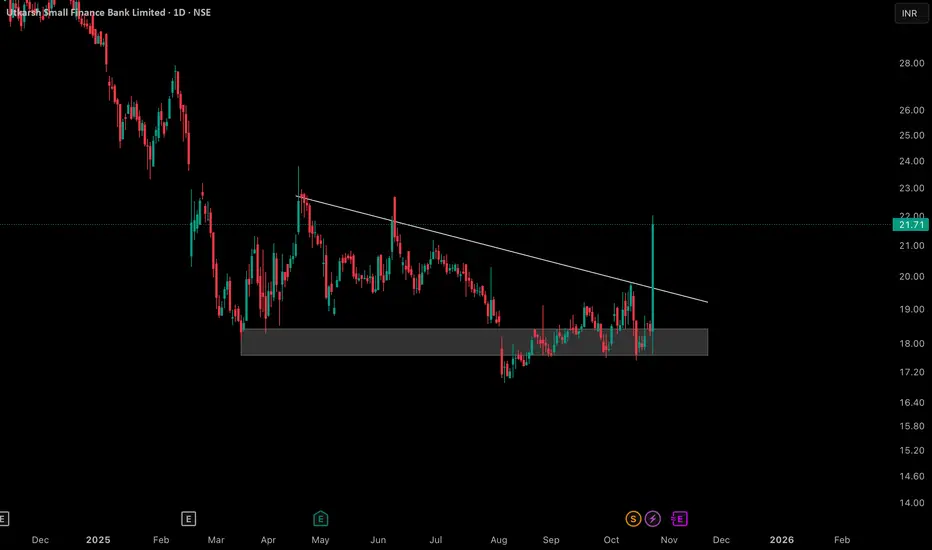
The daily chart for Utkarsh Small Finance Bank Limited displays a well-defined descending triangle, marked by a consistent supply trendline and an established horizontal support zone. During the recent price action, there was a temporary dip below the support, which was quickly retraced as price action returned within the range and formed a distinct lower wick rejection candle at the base.
This chart highlights the role of false moves and re-entries within important technical zones, as well as the reaction to a descending trendline. No trading advice or forecast is implied—this is for educational and analytical purposes, providing an example of how certain classical patterns and market behaviors may unfold within price structure.
This chart highlights the role of false moves and re-entries within important technical zones, as well as the reaction to a descending trendline. No trading advice or forecast is implied—this is for educational and analytical purposes, providing an example of how certain classical patterns and market behaviors may unfold within price structure.
🎯 Master My Self-Made Trading Strategy
📈 Telegram (Learn Today): t.me/hashtaghammer
✅ WhatsApp (Learn Today): wa.me/919455664601
📈 Telegram (Learn Today): t.me/hashtaghammer
✅ WhatsApp (Learn Today): wa.me/919455664601
Powiązane publikacje
Wyłączenie odpowiedzialności
Informacje i publikacje przygotowane przez TradingView lub jego użytkowników, prezentowane na tej stronie, nie stanowią rekomendacji ani porad handlowych, inwestycyjnych i finansowych i nie powinny być w ten sposób traktowane ani wykorzystywane. Więcej informacji na ten temat znajdziesz w naszym Regulaminie.