Long
Double Bottom Chart Pattern
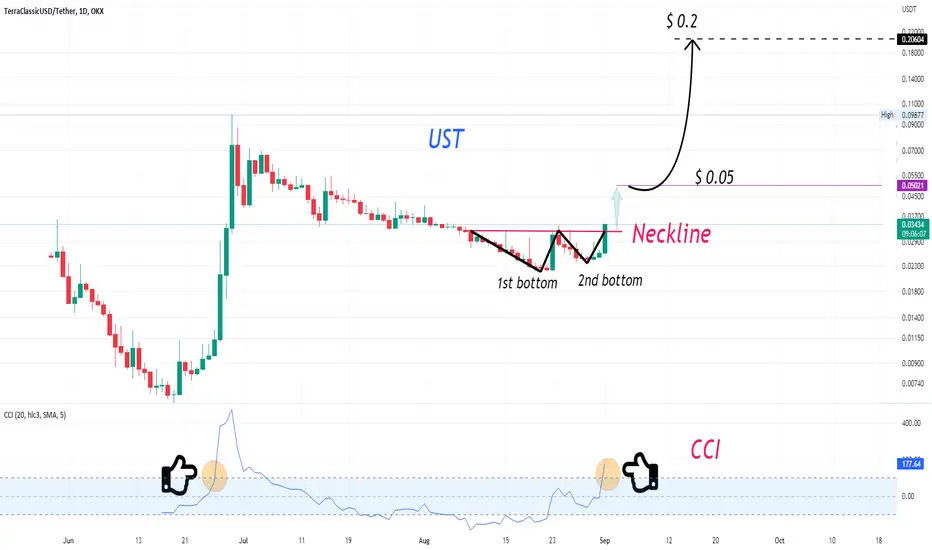
The chart above displays a double bottom pattern after a strong downtrend.
This means that there is a wide window of opportunity
Target- 1 = $ 0.05
Target -2 = $ 0.2
Target- 3= $ 0.282 (+850%)
Uwaga
Uwaga
Uwaga
Uwaga
UST +51%Uwaga
(Yesterday), people thought I was wrong :)Uwaga
Uwaga
Uwaga
Uwaga
Uwaga
Elliott Wave(s)Uwaga
Uwaga
Uwaga
Uwaga
Uwaga
Uwaga
Uwaga
Uwaga
Powiązane publikacje
Wyłączenie odpowiedzialności
Informacje i publikacje przygotowane przez TradingView lub jego użytkowników, prezentowane na tej stronie, nie stanowią rekomendacji ani porad handlowych, inwestycyjnych i finansowych i nie powinny być w ten sposób traktowane ani wykorzystywane. Więcej informacji na ten temat znajdziesz w naszym Regulaminie.